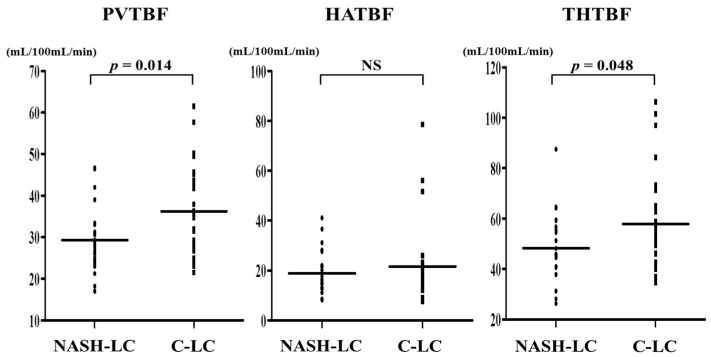
Figure 1.
Comparison of each TBF at initial LC (Child-Pugh A) in NASH-LC and C-LC. PVTBF and THTBF are significantly lower in NASH-LC than in C-LC (p = 0.014, p = 0.048, respectively). HATBF is not significantly different between the LC groups. NS: not significant; PVTBF: portal venous tissue blood flow; HATBF: hepatic arterial tissue blood flow; THTBF: total hepatic tissue blood flow; NASH-LC: liver cirrhosis related to nonalcoholic steatohepatitis; C-LC: liver cirrhosis related to hepatitis C virus.

