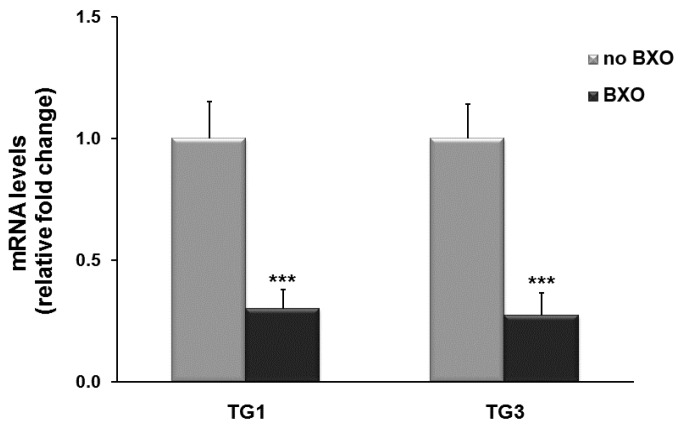
Figure 3.
TG1 and TG3 transcript levels in foreskin tissues from patients with and without BXO (no BXO). Results from real-time PCR are expressed as relative fold change compared with foreskin from patients without BXO (no BXO). The data are the means ± standard error of the mean (SEM). *** p < 0.0001 shows significant differences in comparison with patients without BXO.

