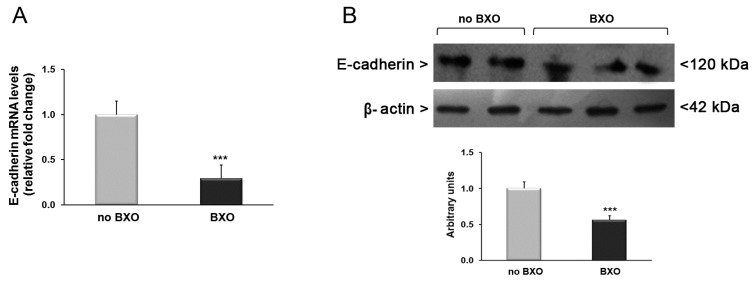
Figure 4.
Analysis of expression levels of E-cadherin in foreskin tissues from patients with (n = 15) and without (n = 15) BXO. (A) Results obtained by real-time PCR are expressed as relative fold change compared with patients without BXO. Error bars represent standard error of the mean; (B) Western blot analysis of E-cadherin protein amounts. This picture is representative of foreskin tissues from patients with and without BXO. A representative densitometric analysis of all samples is also reported (bottom). The results are expressed as mean ± SEM. *** p < 0.0001 significant differences in comparison with patients without BXO.

