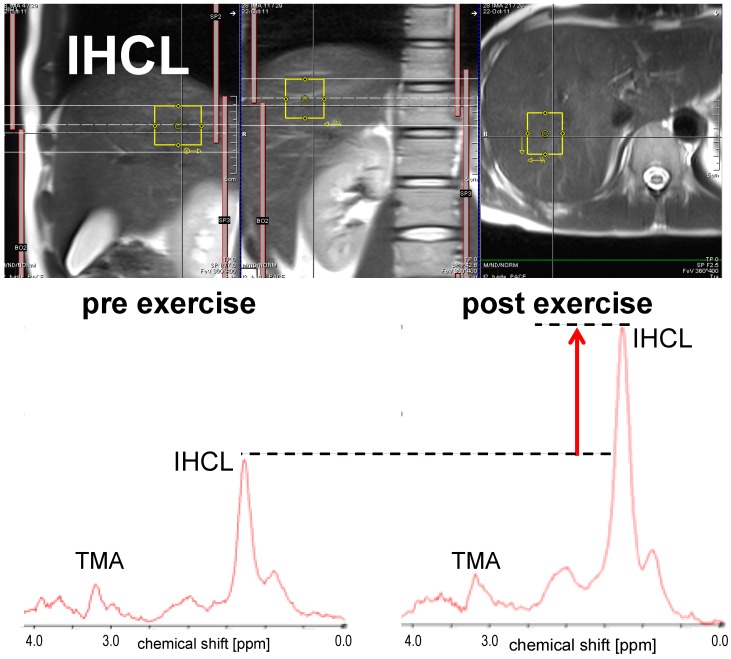
Figure 2.
Sample 1H-MR spectra for the quantification of IHCL obtained before and after an exercise bout of 2 h: The largest peak in the spectrum originates from the aliphatic methylene groups in the fatty acid chains of IHCL. Direct comparison of the pre- and post-exercise spectra shows that IHCL were built up during/after the exercise. Other peaks originate from further protons on the IHCL lipid chains, and trimethyl-ammonium (TMA) groups from metabolites, like betain, or the phosphocholines (for details of the acquisition methods, see [43]; in short: single volume (~19 cm3), stimulated echo localization, echo time 13 ms, 3T, spectra obtained in sync with respiration, triggered for acquisition in expiration). The spin-echo images above the spectra that had also been obtained in expiration show the typical location where the spectra were obtained.

