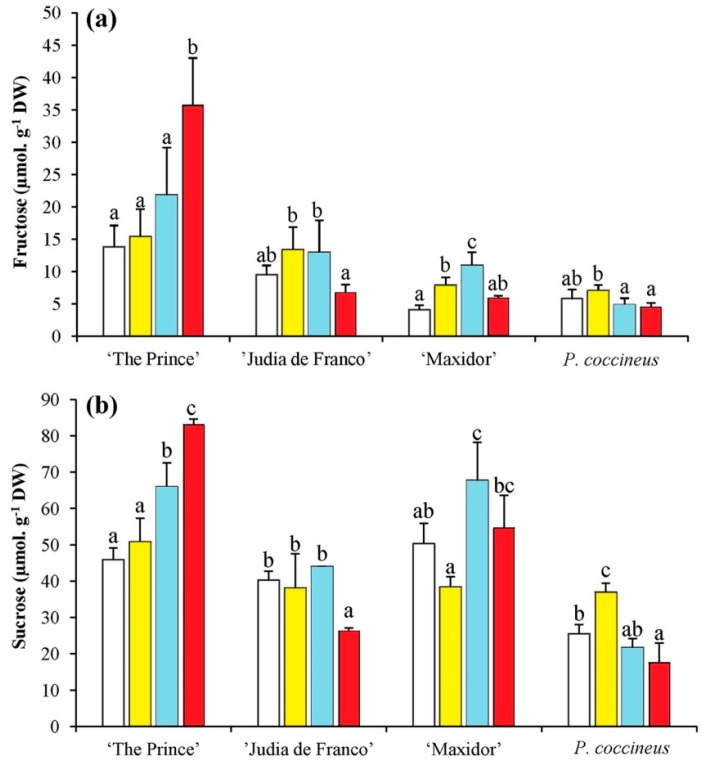
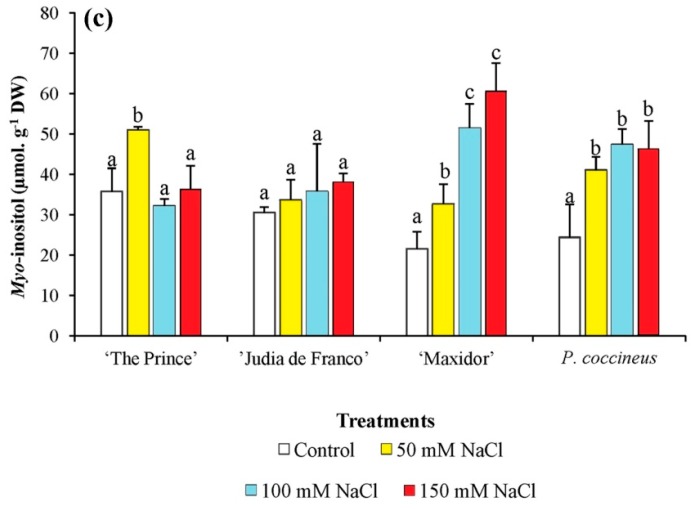
Figure 4.
Salt stress-induced changes in the levels of major soluble carbohydrates of 5-week-old Phaseolus plants. Salt stress-induced changes in the levels of: (a) fructose; (b) sucrose; and (c) myo-inositol, separated by HPLC, in the same samples as in Figure 2. Measurements were performed after three weeks of treatment. The values shown are means with SD (n = 5). For each cultivar, different lowercase letters indicate significant differences between treatments according to the Tukey test (α = 0.05).


