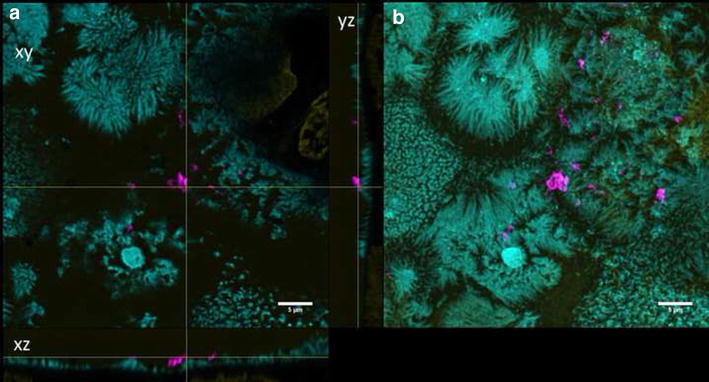
Fig. 4.

Differentiated cells exposed to QD-NH2. Confocal images of differentiated Caco-2 cells incubated for 3 days with QD-NH2 (45 µg cadmium ml−1). a Orthogonal views (xy, xz and yz) showing the intersection planes at the position of the yellow cross-hair. b Maximum intensity projection of the same z-stack. QDs (magenta), cell membrane (cyan) and nucleus (yellow)
