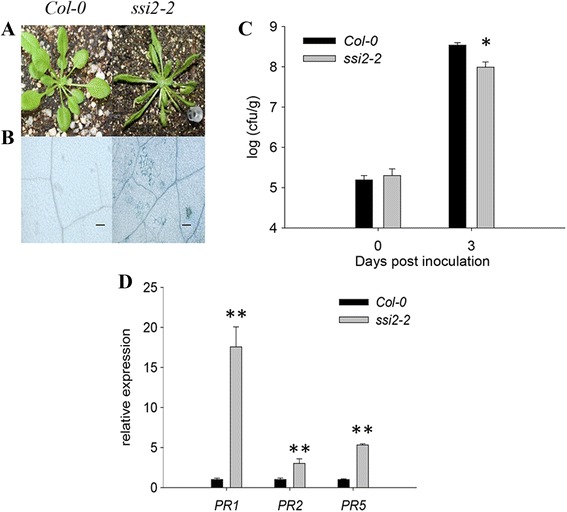
Fig. 1.

Phenotypic differences between the wild-type and ssi2-2 mutant plants. a The phenotype of Col-0 and the ssi2-2 mutant plants grown in a culture chamber at 22 °C for 4 weeks. b Col-0 wild-type and ssi2-2 mutants stained with trypan blue. Scale bars = 100 μm. c Growth of Pst DC3000 in the leaves of wild-type and ssi2-2 mutant plants which cultured for 4 weeks. Three leaves were harvested from infected leaves and then weighed, together homogenized in 10 mM MgCl2, diluted 105-or 106-fold, and plated on King’ s B medium. The bacterial population was determined from three replicates at each time point by counting colony-forming units (cfu). The “0 day” point represents 2 h after bacterial inoculation. Each point represents the mean ± standard deviation. The experiments were repeated three times. Significance was determined by Student’s t test. * P < 0.05. d The expression of PR1, PR2, PR5 in ssi2-2 mutants. The test performed by quantitative RT-PCR analysis. Transcript abundance of genes was normalized to that of the reference gene ACTIN2 (AT3G18780). The data are shown as means ± SD from three biological replicates. The experiments were repeated three times. ** P < 0.01
