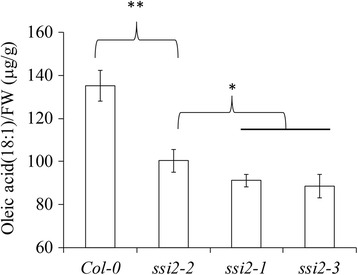
Fig. 6.

Oleic acid content in leaf tissues of Col-0, ssi2-1, ssi2-2 and ssi2-3 plants. All measurements were made on plants grown at 22 °C for 4 weeks, and data are presented as μg ± SD (n = 6). Significance was determined by Student’s t test. *Indicates significant differences at P < 0.05, ** Indicates significant differences at P < 0.01
