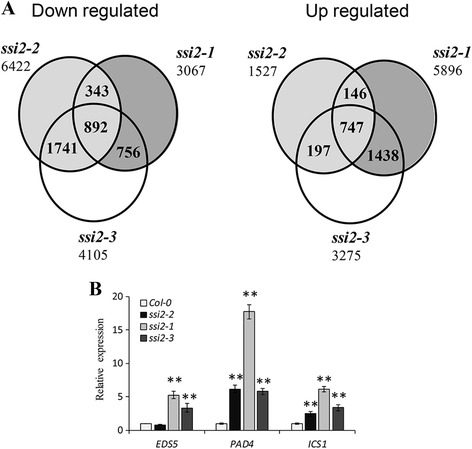
Fig. 7.

Gene expression profiling. a Statistics for transcriptome sequencing of Col-0 and three ssi2 mutants. b Quantitative RT-PCR analysis of three SA pathway genes to validate the RNA-seq data of up-regulated genes. The data are shown as means ± SD from three biological replicates. The experiments were repeated two times. Significance was determined by Student’s t test. ** Indicates significant differences at P < 0.01
