Fig. 6.

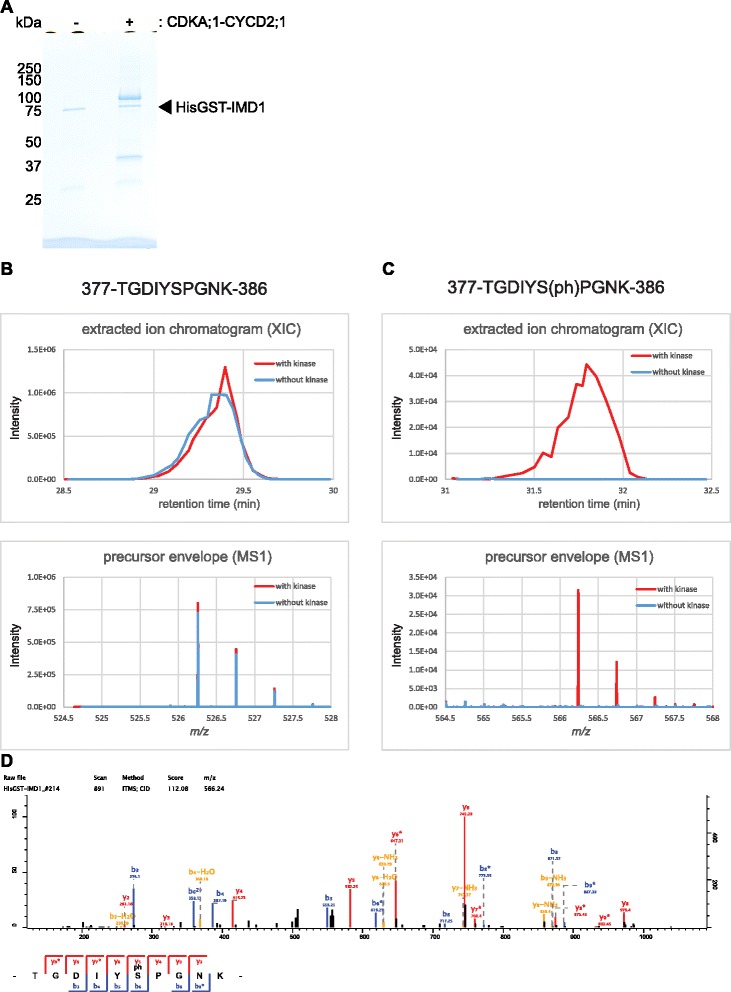
Identification of phosphorylation sites of IMD1 treated with CDKA;1-CYCD2;1 complexes in vitro. a Gel image of HisGST-IMD1 subjected to mass spectrometry analyses. The IMD1 proteins were treated without (−) and with (+) CDKA;1-CYCD2;1. The proteins were separated by SDS-PAGE after the kinase reaction and stained with coomassie brilliant blue. b Mass chromatograms (top) of the selected peptide and mass spectrum (bottom) of the peptide. Corresponding to (c), the non-phosphorylated peptide 377-TGDIYSPGNK-386 was detected in the both samples of IMD1 treated with (red) and without (blue) CDKA;1-CYCD2;1 complexes. c Mass chromatograms (top) of the selected peptide and mass spectrum (bottom) of the peptide. The phosphopeptide 377-TGDIYS(ph)PGNK-386 was detected only in the sample of IMD1 treated with CDKA;1-CYCD2;1 (red), but not in the sample without kinase (blue). S(ph), in the peptide sequence, indicates the phosphorylated serine. d MS/MS spectra of a phosphopeptide (377-TGDIYS(ph)PGNK-386) from IMD1 treated with CDKA;1-CYCD2;1. The b and y ion series represent fragment ions containing the N- and C-termini of the peptide, respectively. Mass chromatogram (b and c, top) is given by plotting the x-axis as the retention time and the y-axis as the ion peak intensity. Mass spectrum (b and c, bottom) is given by plotting the x-axis as the mass-to-charge ratio (m/z) and the y-axis as the ion peak intensity
