
Fig. 2.
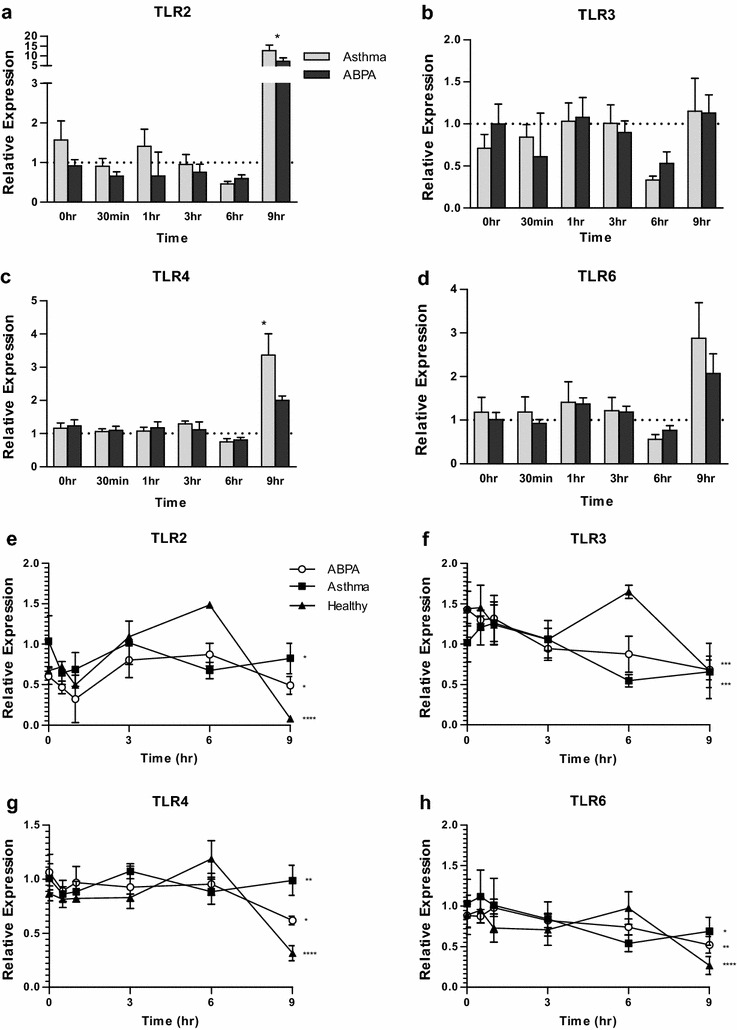
Expression of TLRs by MDMs from ABPA, asthmatic and healthy subjects (n = 10, pooled). a–d show expression in the ABPA (black bars) and asthma groups (grey bars) relative to the healthy group (dotted line) at each time point. Stars indicate significant differences between ABPA and asthma, calculated by t-test. e–h show expression in ABPA (open circles), asthmatic (closed squares) and healthy (closed triangles) subjects over time, relative to asthma 0 h. Stars indicate significant changes over time, calculated by repeated measures 1-way ANOVA. *p < 0.05; **p < 0.01; ***p < 0.001; ****p < 0.0001. Bars indicate standard deviation of the three replicates