Fig. 5.

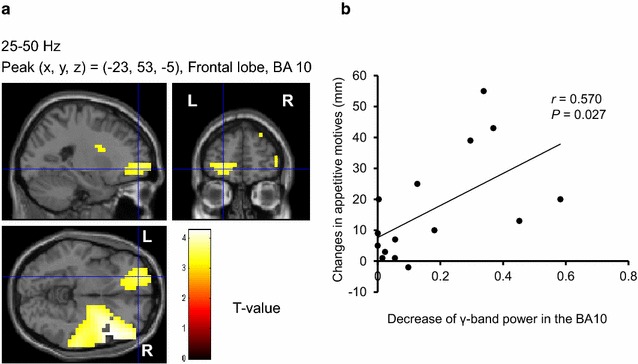
Localization and intensity of the decrease of γ-band power during the eye-closed session after the cessation of the visual stimulation session, relative to the band power before the start of the visual stimulation session in the frontal pole (BA10) (a) (random effect analyses of 15 participants, P < 0.05, corrected for multiple comparisons at voxel level) and association of the power decrease with the changes in appetitive motives during and after visual food stimulation assessed by 100 mm VAS scores (b). a The results are superimposed on high-resolution MRIs averaged across all the participants. Sagittal (upper left), coronal (upper right), and axial (lower left) sections are shown. The color bar indicates T values. b Linear regression line, Pearson’s correlation coefficient (r), and P value are shown. BA Brodmann’s area, R right, L left, VAS visual analogue scale
