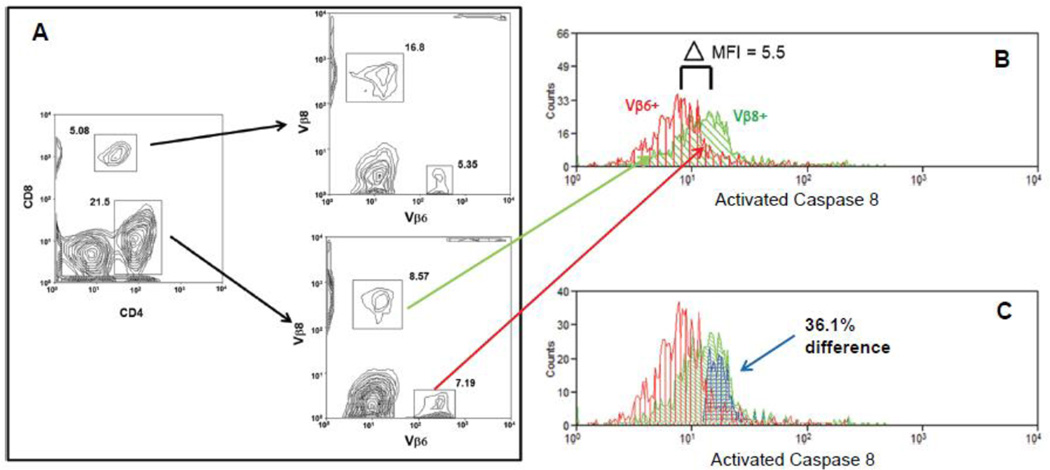
Figure 1.
Gating scheme and analysis protocol. (A) Visualization and gates defining CD8 and CD4 positive T cells, followed by visualization and gates defining the Vβ6 and Vβ8 subpopulations. (B) Histograms of SEB stimulated caspase 8 activation for CD4+ Vβ8+ (green) and CD4+ Vβ6+ (red) T cells. Δ MFI represents the difference between the mean fluorescent indexes for the two histograms. (C) Overton subtraction of the CD4+ Vβ6+ caspase 8 activity histogram (red) from the CD4+ Vβ8+ caspase 8 activity histogram (green) yields the difference histogram (blue).

