
Figure 1.
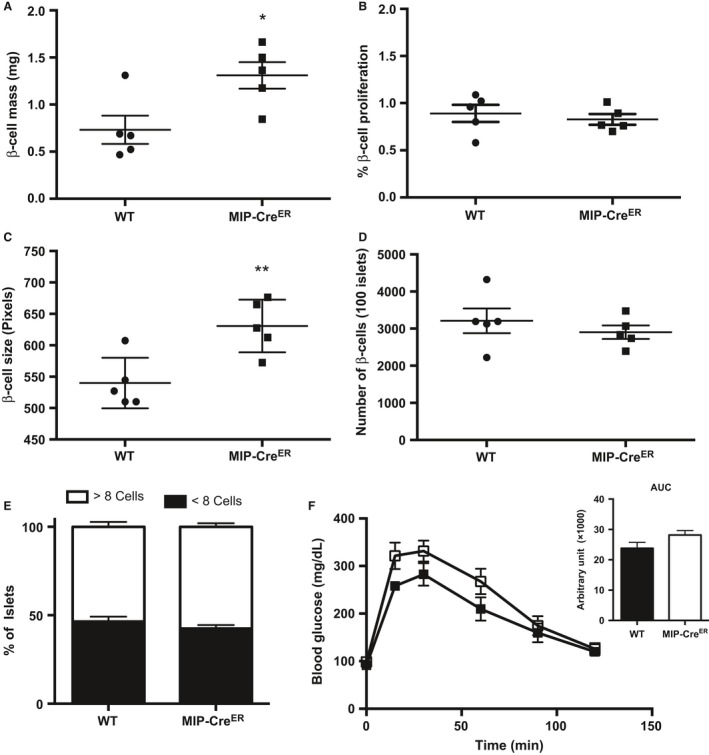
Chow‐fed MIP‐CreER mice have enhanced β‐cell mass due to increased β‐cell size. (A) β‐cell mass, (B) β‐cell proliferation, (C) β‐cell size, (D) β‐cell number, (E) percentage of small insulin+ clusters, and (F) Intraperitoneal glucose tolerance tests (IP‐GTT) and area under the curve (AUC) of IP‐GTT for chow‐fed 8‐week‐old WT (n = 5) or MIP‐CreER (n = 5) male mice. Black boxes represent WT mice; open boxes represent MIP‐CreER mice. Data are shown as means ± SEM. P values were calculated using Student's t‐test for (A–C), (E) and two‐way ANOVA followed by Tukey post hoc analysis for D. *P = 0.02 in (A); **P = 0.0081 in (C).