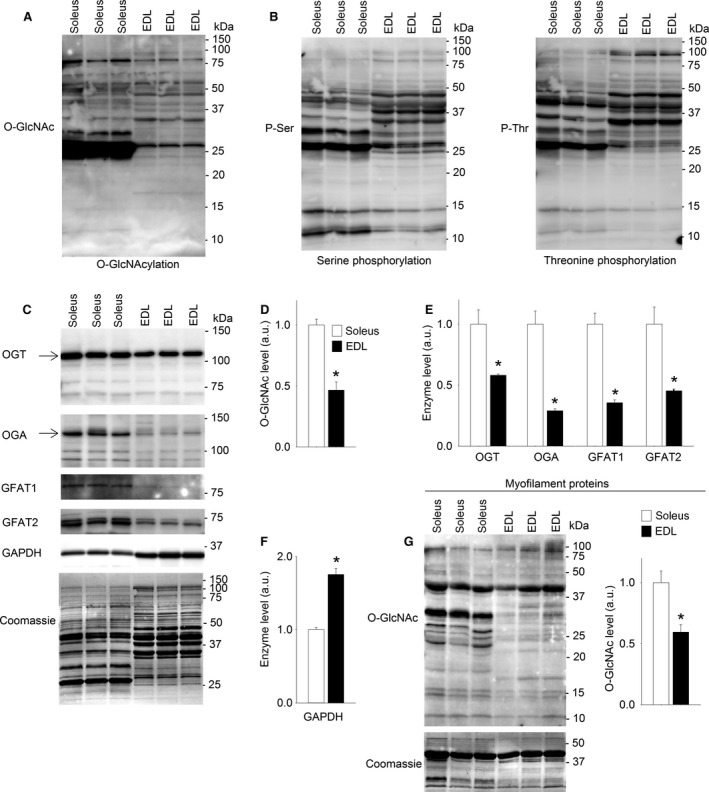
Figure 2.

Higher levels of protein O‐GlcNAcylation in slow twitch than fast twitch skeletal muscle. Total protein lysates analyzed by immunoblotting for O‐GlcNAcylation (A), protein phosphorylation at serine and threonine residues (B), and O‐GlcNAc transferase (OGT), O‐GlcNAcase (OGA), glutamine fructose‐6‐phosphate amidotransferase isoforms 1 (GFAT1), and glutamine fructose‐6‐phosphate amidotransferase isoforms 2 (GFAT2), and GAPDH enzymes (C) from resting slow twitch soleus and fast twitch EDL (Wistar rats). Average data (D, E, and F) shown as mean ± SEM, with staining intensities in EDL (black bars) calculated relative to soleus (white bars). O‐GlcNAcylation of myofilament proteins (G) analyzed by immunoblotting, and shown as average O‐GlcNAcylation level in EDL calculated relative to soleus. Equal loading was confirmed by Coomassie staining. Arrows indicate the bands included in the calculation of OGT and OGA (n = 3. *P < 0.05 vs. soleus).
