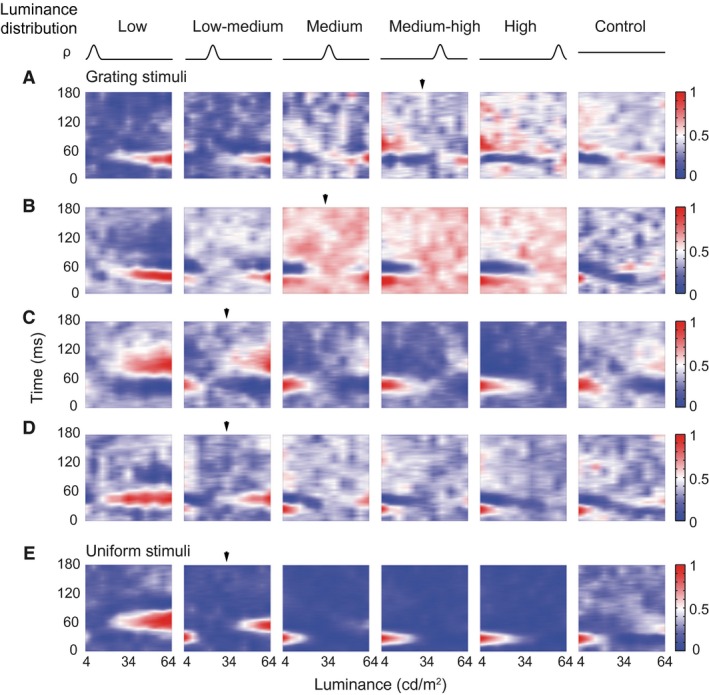
Figure 3.

Reversal cells respond to both luminance decrements and increments when the high density of stimuli (HDS) is distributed in an intermediate range of luminance. (A–D) Four examples of reversal cells that responded to both luminance increments and decrements when the HDS was located in medium–high (A), medium (B), and low–medium ranges of luminance (C, D), as indicated by arrowheads. The reversal occurred at different time latencies (A, C, D) or the same latency (B) after stimulus onset (y‐axis of each panel). x‐axis was the luminance of stimuli. Blue‐white‐red color code: normalized responses. All four cells were complex cells. (D, E) Example responses of a reversal cell to luminance distributions expressed by gratings (D) and uniform patches (E). This cell exhibited similar response patterns to these two types of stimuli that had the same luminance distribution probabilities (ρ), luminance ranges, and stimulus sizes.
