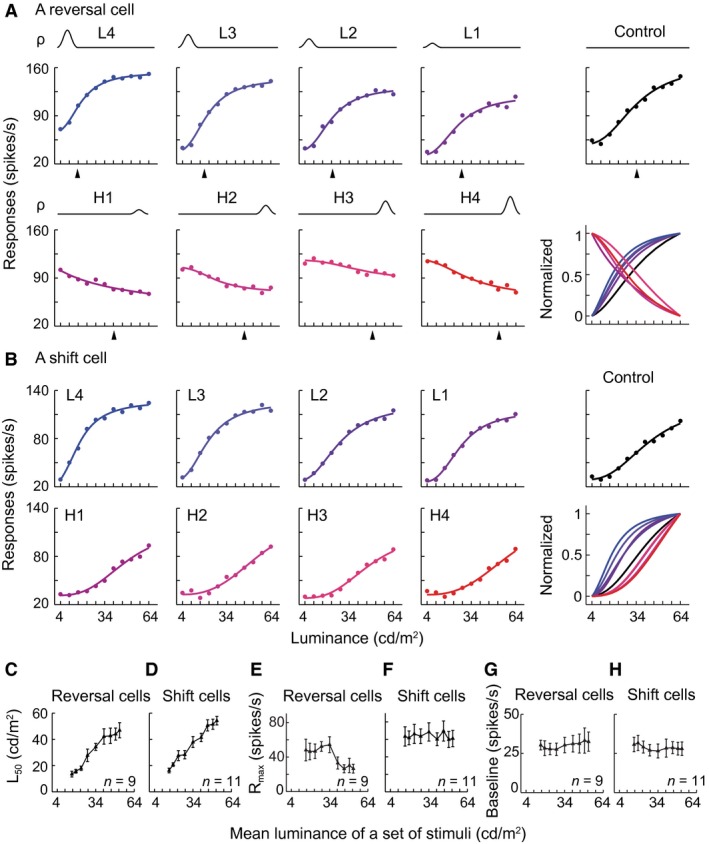
Figure 5.

Luminance response functions (LRF) were systematically modulated by the intensity of the luminance distribution. (A, B) Representative responses of a reversal cell (complex cell) and a shift cell (complex cell) to nine sets of luminance distributions in Figure 1C. Dots represent raw data calculated from a reverse correlation algorithm. Curves were fitted by the Naka‐Rushton equation. In the lower right panels of (A, B), each curve was normalized by the largest value minus the smallest value of a fitted LRF. A color indicates the corresponding LRF and normalized curve. (C–H) Effects of the gradual changes of luminance distribution on the L 50, R max, and baseline of the LRFs of reversal cells (n = 9) and shift cells (n = 11). In (C), linear regression, slope = 0.95, R 2 = 0.96; P < 0.01. In (D), slope = 1.01, R 2 = 0.98; P < 0.01. In (E), for each of the left 4 data points compared with the control (central point), t‐test, all P > 0.05, n = 9; and for each of the right 4 data points compared with the control, all P < 0.05, n = 9. In (F–H), one‐way ANOVA for each of the three cases, all P > 0.05; n = 11 cells, n = 9 cells, and n = 11 cells). The center data points of (C–H) were the responses to the control distribution. Arrowheads: mean luminance of a stimulus set. Vertical bar: SEM.
