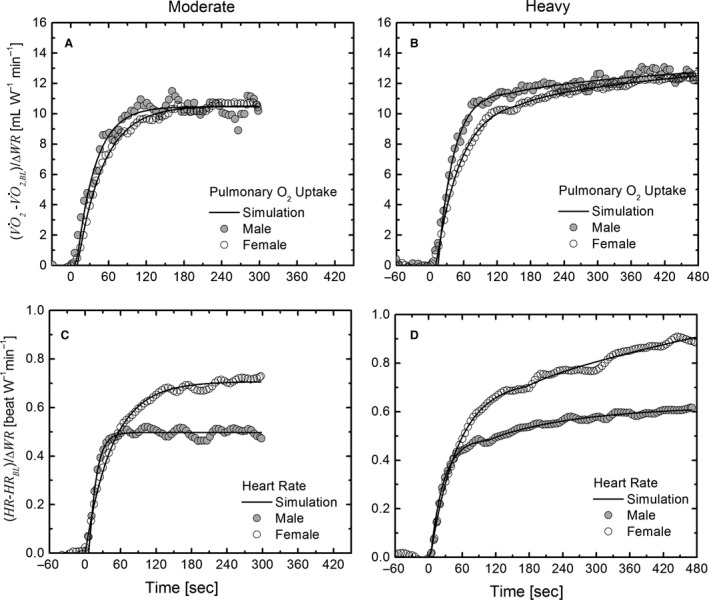
Figure 1.

Comparison of model simulations (line) and experimental data of mean (A, B) and heart rate (C, D) dynamic response to constant work rate exercise of moderate and heavy intensity in a representative female (open circle symbols) and male (closed circle symbols) adolescent. The graphs of the mean responses are showed with 5 sec intervals of time and ensemble averages of interpolated and time‐aligned breath‐by‐breath data from individual transitions from warm up at 20 W. The subscript BL indicates the steady‐state value at the warm up.
