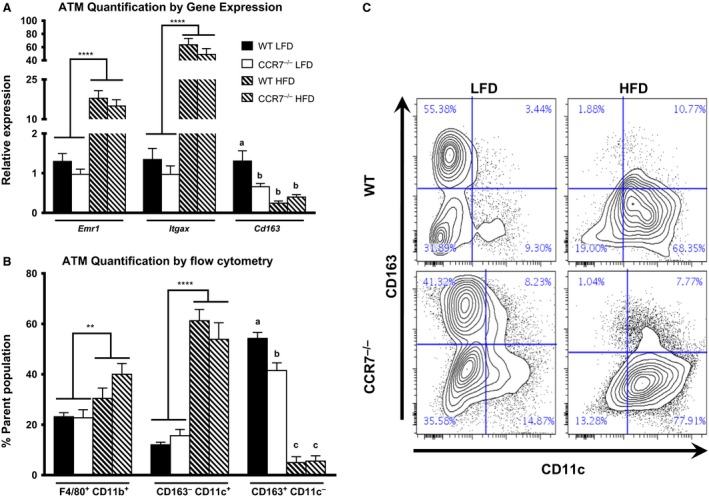
Figure 3.

Adipose tissue (AT) macrophage quantification and polarization. (A) Comparison of AT mRNA expression of ATM markers in low fat diet (LFD) and high fat diet fed WT and CCR7−/− mice (n = 9–14/group, ****P < 0.0001 for diet effect, P < 0.05 for groups not connected by the same letter). Please note, the WT LFD group was set as the reference group for each gene individually. (B) Quantification of ATM populations via flow cytometry. CD163− CD11c+ and CD163+ CD11c+ populations are derived from the F4/80+ CD11b+ parent population (n = 6–8/group, ****P < 0.0001 for diet effect, **P < 0.01 for diet effect, P < 0.05 for groups not connected by the same letter). (C) Representative flow plot of CD163 and CD11c expression from F4/80+ CD11b+ ATMs.
