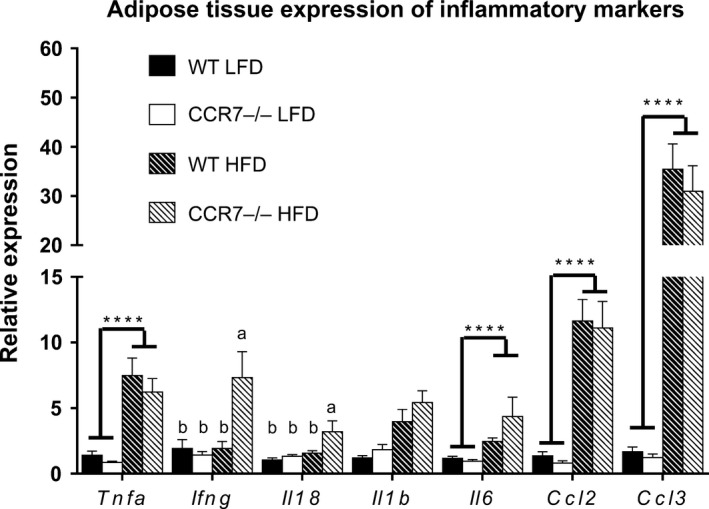
Figure 5.

Adipose tissue (AT) inflammation. Comparison of AT mRNA expression of inflammatory chemokines and cytokines in low‐fat diet and high‐fat diet fed WT and CCR7−/− mice (n = 9–14/group (except for Il18 where n = 5/gp), ****P < 0.0001 for diet effect, **P < 0.01 for diet effect, P < 0.05 for groups not connected by the same letter).
