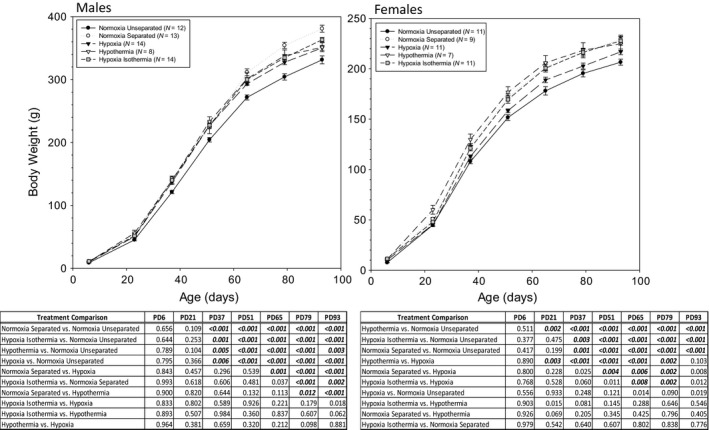
Figure 1.

(A) Male and female body weights over time from PD6 to PD93. Rats were weighed at the completion of each treatment (PD6) and every 2 weeks post‐weaning until PD93. (B) Significant differences (P values) between neonatal treatments within gender are listed in the corresponding tables. Data are presented as mean ± SE. N values are shown in the figure labels.
