Figure 6.

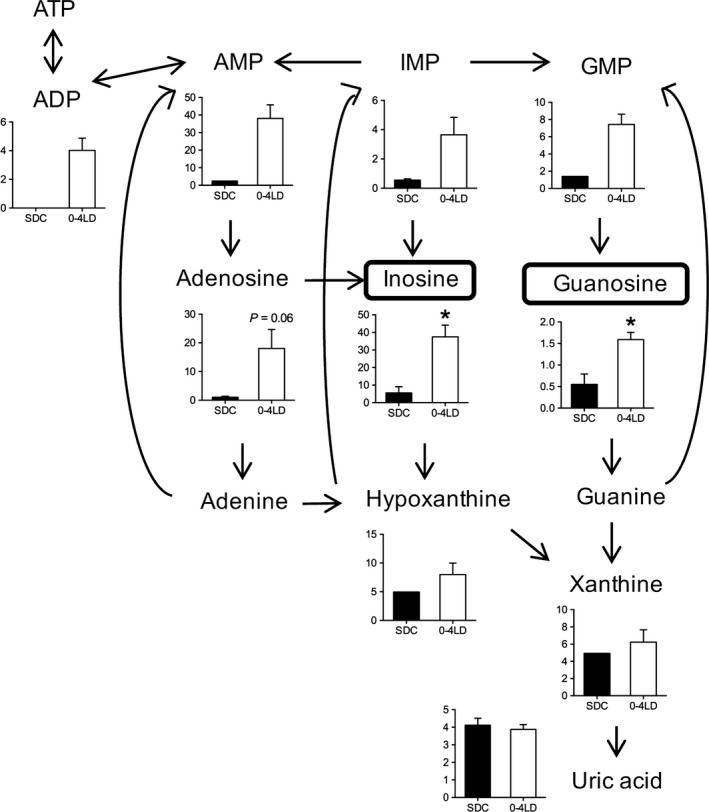
Purine metabolic pathway. Graphs for each metabolite show the relative area values of metabolites in SDC and 0–4 LD. Levels of inosine and guanosine were significantly higher in 0–4 LD than in SDC. *P < 0.05, t‐test.

Purine metabolic pathway. Graphs for each metabolite show the relative area values of metabolites in SDC and 0–4 LD. Levels of inosine and guanosine were significantly higher in 0–4 LD than in SDC. *P < 0.05, t‐test.