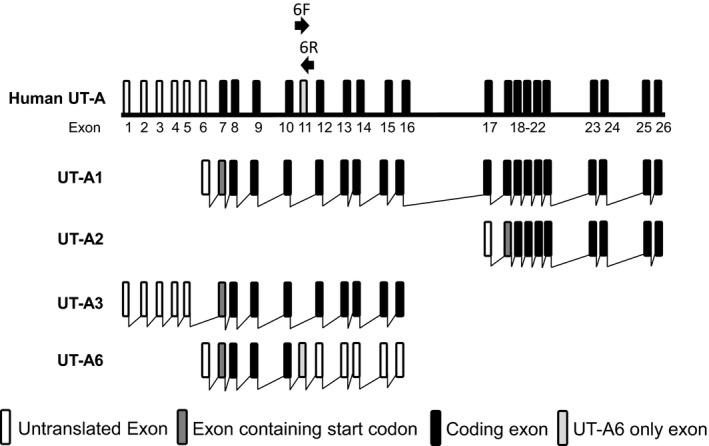
Figure 1.

Schematic diagram representing the basic structure of the human SLC14A2 (UT‐A) gene. It should be noted that exon 11 is only included in UT‐A6 and not in any of the other UT‐A isoforms. Labeled arrows show the location and direction of the forward (6F) and reverse (6R) primers used to amplify UT‐A6 in this study. [Diagram adapted from Smith and Fenton 2006.]
