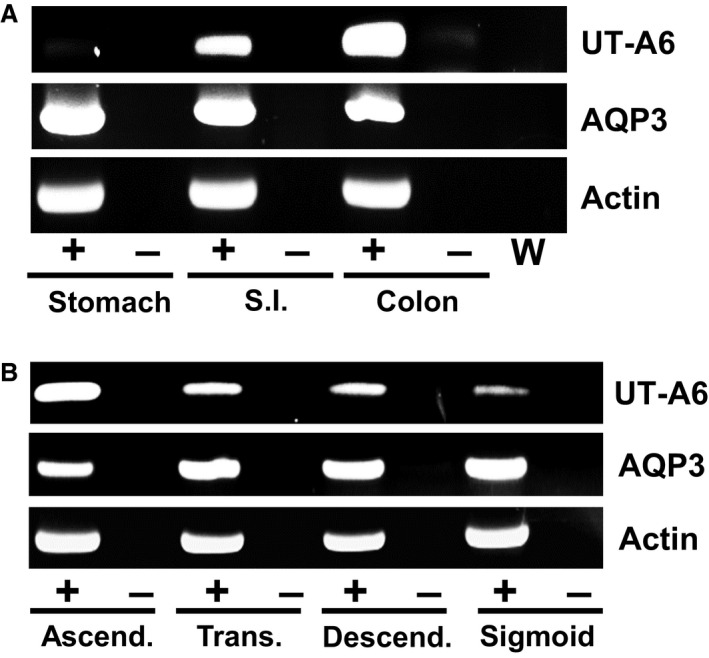
Figure 3.

End‐point PCR experiments investigating UT‐A6 expression in the human gastrointestinal tract. (A) Using cDNA derived from mRNA samples (each N = 1), strong signals were detected for actin and AQP3 in all gastrointestinal tissues. In contrast, 128 bp UT‐A6 signals were varied, with a clear expression pattern showing colon > small intestine ≫ stomach. (B) Using cDNA derived from total RNA colonic samples (each N = 1), UT‐A6 signals were again varied with the strongest signal in ascending colon and the weakest signal in sigmoid colon. No such differences were observed for either actin or AQP3. Key: RT = reverse transcriptase; + = RT present; − = RT absent; W = water control.
