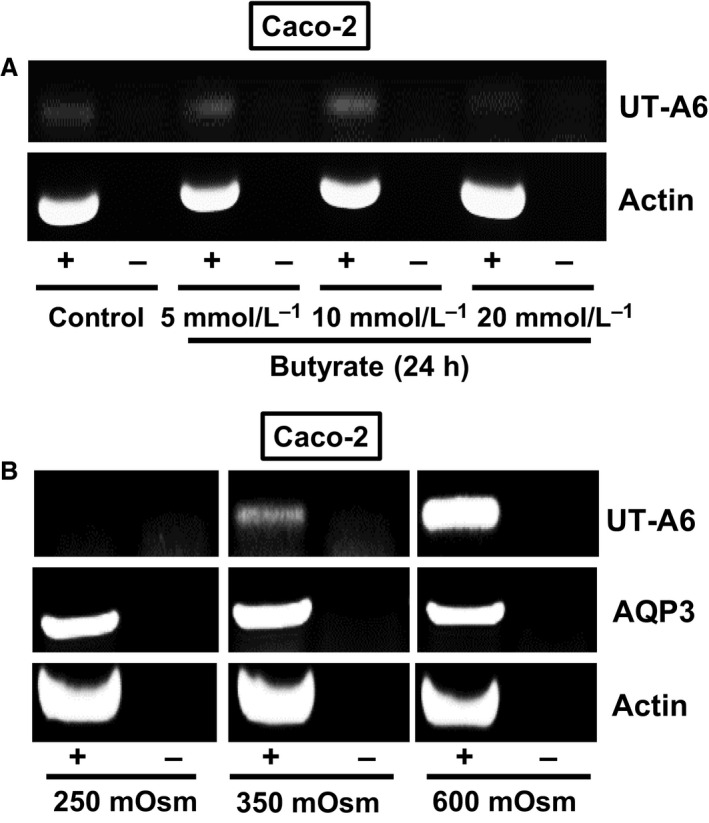
Figure 4.

End‐point PCR experiments investigating UT‐A6 expression in the Caco‐2 cell line. (A) Using cDNA derived from total RNA samples (each N = 1), only very weak UT‐A6 signals were detected. These UT‐A6 signals were unaffected by 24 h incubation in different concentrations of butyrate. (B) In contrast, UT‐A6 signals varied with changing the osmolality of the culture media for 24 h prior to RNA preparation. No UT‐A6 signal was detected in the 250 mOsm samples, a weak signal was present with 350 mOsm (i.e., normal media), and a strong signal obtained with 600 mOsm. In contrast, no changes were observed in either actin or AQP3 signals. Key: RT = reverse transcriptase; + = RT present; − = RT absent.
