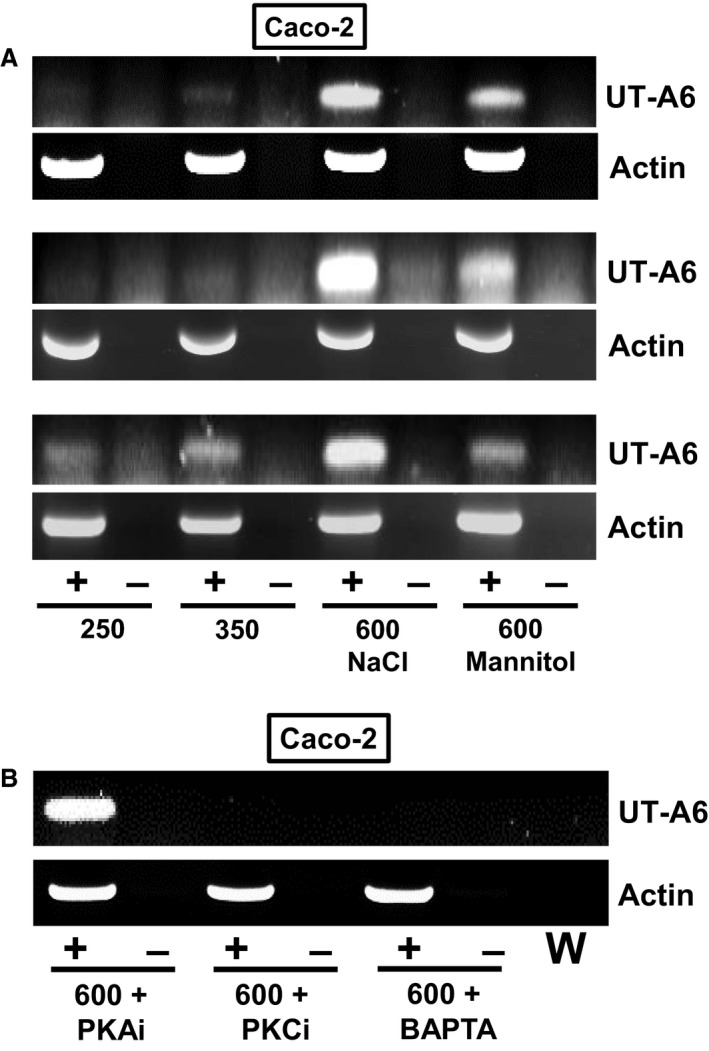
Figure 5.

End‐point PCR experiments further investigating UT‐A6 expression in the Caco‐2 cell line. (A) Increased UT‐A6 signals were detected with hyperosmotic media (i.e., 600 mOsm due to an additional osmolyte), with greater increases observed with NaCl when compared to mannitol. (B) Addition of either a protein kinase C inhibitor or an internal calcium chelator (i.e., BAPTA‐AM) to the culture media totally ablated the UT‐A6 signal in 600 mOsm hyperosmotic conditions. No such effect was observed with the addition of a protein kinase A inhibitor. Key: RT = reverse transcriptase; + = RT present; − = RT absent; W = water control; PKAi = 0.5μmol/L protein kinase A inhibitor; PKCi = 1 μmol/L calphostin C (i.e., protein kinase C inhibitor); BAPTA = 50 μmol/L BAPTA‐AM.
