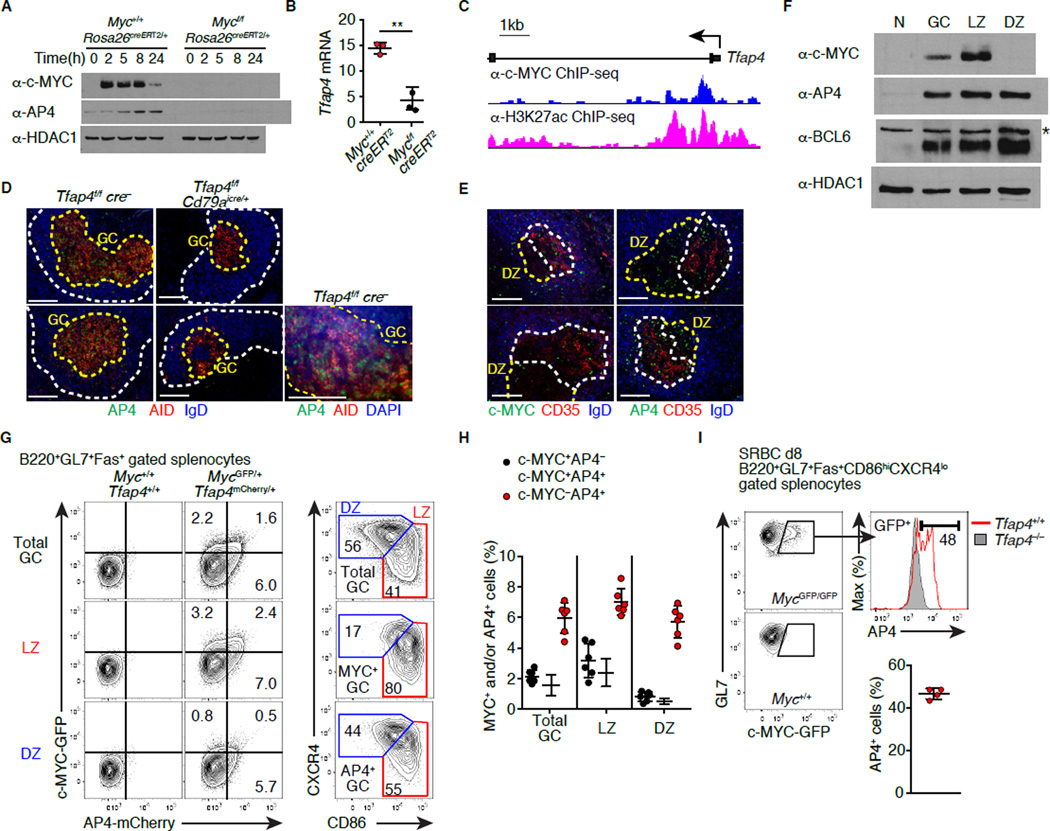
Figure 1. GC B cells express the c-MYC-inducible factor AP4.
(A and B) Expression of AP4 protein and cell number-normalized Tfap4 mRNA (2 hours) in B cells that were harvested from Tamoxifen-treated Mycf/fRosa26creERT2/+ and co-cultured with CD40L-expressing feeders. Data are representative of three experiments.
(C) Binding of c-MYC to the Tfap4 locus in CD40L-activated B cells. Histograms of sequence tags pulled down with anti-c-MYC or anti-H3K27ac antibody are shown.
(D) Staining for AP4, AID and IgD of spleen sections eight days after SRBC immunization. B cell follicles (Fo) and GCs are marked by white and yellow dashed lines, respectively. Data are representative of two experiments.
(E) Staining for AP4 and c-MYC of spleen sections eight days after SRBC immunization. LZ and DZ of GCs defined by the presence of CD35+ FDCs are shown with white and yellow dashed lines, respectively. Data are representative of two experiments.
(F) AP4, c-MYC, and BCL6 protein amounts in naive (N), total B220+GL7+Fas+ GC, CD86hiCXCR4lo LZ and CD86loCXCR4hi DZ B cells eight days after SRBC immunization. Data are representative of three experiments. *: non-specific band.
(G and H) Expression of GFP and mCherry in GC B cells of MycGFP/+Tfap4mCherry/+ mice eight days after SRBC immunization (G). Distribution of AP4-mCherry+ or c-MYC-GFP+ cells in the LZ and DZ defined by CD86 and CXCR4 expression is shown in the right panels (G). Frequencies of AP4- or c-MYC-expressing cells in total GC, LZ and DZ GC B cells from two independent experiments are shown in (H).
(I) Intracellular staining for AP4 in c-MYC-GFP+ LZ GC B cells eight days after SRBC immunization. Staining for AP4 in Tfap4−/− LZ cells is shown as control. Data are pooled from two experiments.
Data in (B, H and I) are shown by means ± SD. Unpaired Student’s t test. n = 3 per group (A and B); n = 4 (D and E); n = 3 (F); n = 6 for (G and H); n = 4 for MycGFPTfap4+/+ and n = 2 for Tfap4– /– mice (I). See also Figure S1. Scale bar, 100 µm.

