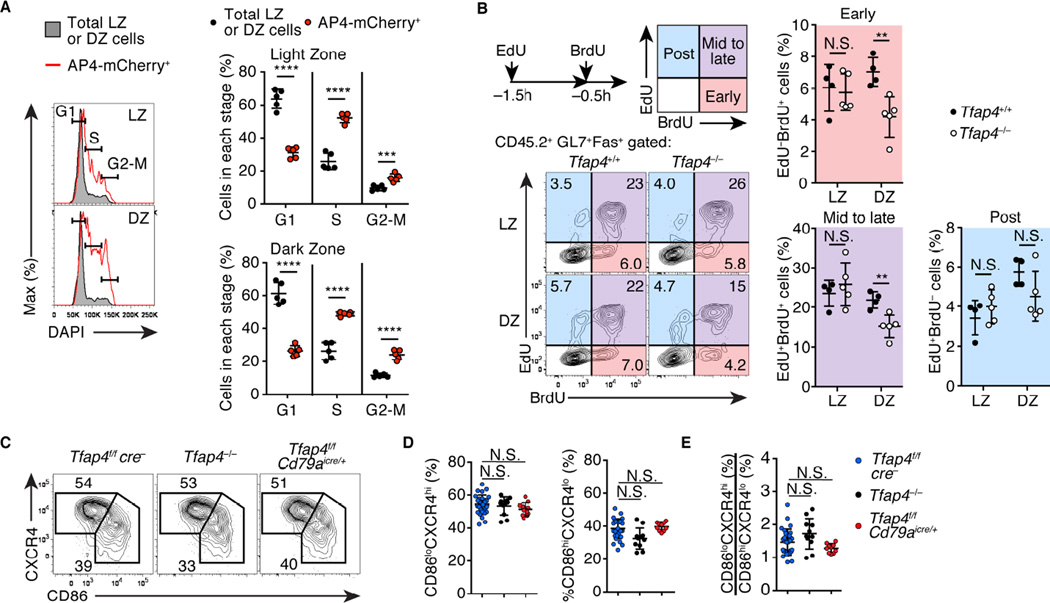
Figure 3. AP4 enhances GC B cell proliferation through the regulation of cell cycle re-entry in the DZ.
(A) Cell cycle analysis by DNA content measurement of AP4-mCherry+ LZ and DZ cells compared to total LZ and DZ cells from Tfap4mCherry reporter mice eight days after SRBC immunization. Data are pooled from two independent experiments.
(B) Cell cycle analysis by sequential EdU and BrdU labeling of CD45.2 Tfap4−/− and control Tfap4f/fcre− donor LZ and DZ GC B cells in mixed bone marrow chimeras eight days after NP-CGG immunization. Early-, mid to late-, and post-S phases of the cell cycle were defined as previously described (Gitlin et al., 2014). Representative plots and statistical analysis from two independent experiments are shown.
(C–E) Expression of CD86 and CXCR4 in B220+GL7+Fas+ GC B cells from mice with indicated genotypes ten days after NP-CGG immunization. Representative plots (C) and statistical analysis of frequencies of LZ (CD86hiCXCR4lo) and DZ (CD86loCXCR4hi) cells in the GC B cell compartment (D) and DZ to LZ ratios (E) from four independent experiments are shown. Data in (A, B, D and E) are shown by mean ± SD. Unpaired Student’s t test for (A and B) Oneway ANOVA for (D and E). n = 5 (A); n = 4–5 per group (B); n = 10 for Tfap4−/− and Tfap4f/fCd79aicre/+ , and n = 28 for Tfap4f/fcre− (D and E). See also Figure S4.

