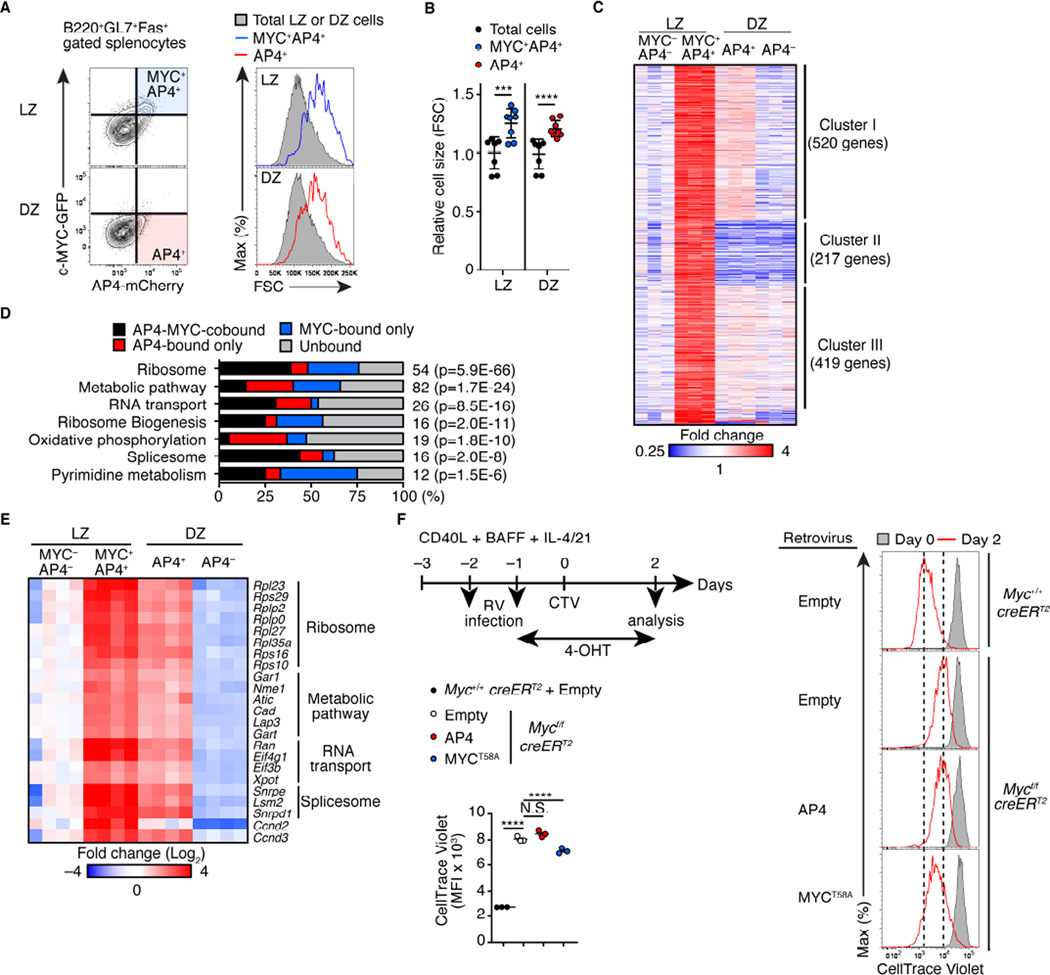
Figure 4. AP4-expressing DZ cells maintain activation signatures following c-MYC downregulation.
(A and B) Relative cell sizes (forward scatter) of MYC+AP4+ LZ and DZ B cells from AP4-mCherry and c-MYC-GFP reporter mice eight days after SRBC immunization (A). Statistical analysis from three independent experiments is shown in (B)
(C) RNAseq analysis of MYC−AP4− LZ, MYC+AP4+ LZ, AP4+ DZ and AP4− DZ cells. Expression of genes which were expressed higher by >1.8-fold in MYC+AP4+ LZ cells than MYC−AP4− LZ cells is shown as a heat map following unsupervised clustering analysis that yielded three major clusters.
(D) Pathway analysis of Cluster I genes in (C) combined with ChIPseq analysis showing the frequencies of genes directly bound by AP4, c-MYC, or both in each pathway. The number of genes in each pathway is shown to the right of the bar with P-values for enrichment.
(E) Spike-in qPCR validation of representative AP4-MYC-cobound genes in (D). Expression in four independent samples from two experiments are shown as a heatmap.
(F) Flow cytometric analysis showing CellTrace Violet dilution of Myc-deficient B cells infected with a control retrovirus (RV) or one expressing AP4 or MYCT58A. CD40L-primed Mycf/fRosa26creERT2/+ or Myc+/+Rosa26creERT2/+ splenic B cells were infected with indicated RV, followed by treatment with 4-hydroxytamoxifen (4-OHT), and proliferation was analyzed. Data are representative of two independent experiments.
Data in (B and F) are shown by mean ± SD. Unpaired Student’s t test for (B). One-way ANOVA for (F). n = 6 (A and B); n = 3 (C); n = 3 per group (F). See also Figure S4 and Table S1.

