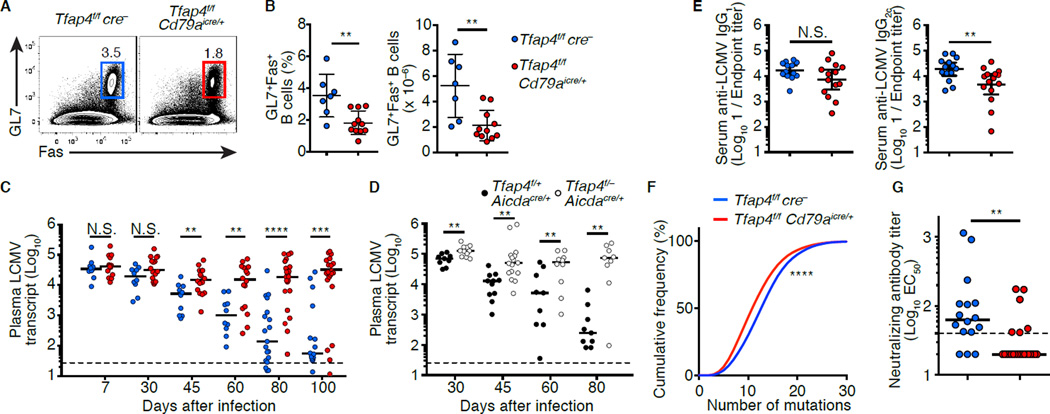
Figure 6. AP4 is essential for humoral responses against chronic viral infection.
(A and B) Frequencies and absolute numbers of B220+GL7+Fas+ cells in the spleens of Tfap4f/fCd79aicre/+ and control Tfap4f/fcre− mice 30 days after infection with LCMV-c13. Data are pooled from two independent experiments.
(C and D) Analysis of plasma LCMV loads in Tfap4f/fCd79aicre/+ and control Tfap4f/fcre− mice (C) and Tfap4f/-Aicdacre/+ and control Tfap4f/+Aicdacre/+ mice (D) after infection. Data are pooled from six (C) and three (D) independent experiments.
(E) Titers of LCMV-binding serum IgG in Tfap4f/fCd79aicre/+ and control Tfap4f/fcre− mice 80 days after infection. Data are pooled from six independent experiments.
(F) Cumulative frequency distribution of somatic mutations of the Igh variable regions in GC B cells in (B). Data are pooled from two independent experiments.
(G) Neutralizing serum antibody titers from Tfap4f/fCd79aicre/+ and control Tfap4f/fcre− mice 80 days after LCMV infection. Neutralizing titers were shown as 1/EC50. Data are pooled from six independent experiments.
Data in (B and E) are show by means ± SD. Lines in (C, D and G) represent medians. Unpaired Student’s t test for (B and E). Mann-Whitney’s ranked test for (C, D and G). Kolmogorov-Smirnov test for (F). n = 7 for Tfap4f/fcre− and n = 11 for Tfap4f/fCd79aicre/+ (A and B); for each time point n = 10–19 for Tfap4f/fcre− and n = 16–25 for Tfap4f/fCd79aicre/+ (C); for each time point n = 9–11 per group (D); n = 12 for Tfap4f/fcre− and n = 14 for Tfap4f/fCd79aicre/+ (E); n = 6 per group (F); n = 14 for Tfap4f/fcre− and n = 25 for Tfap4f/fCd79aicre/+ (G). See also Figure S6.

