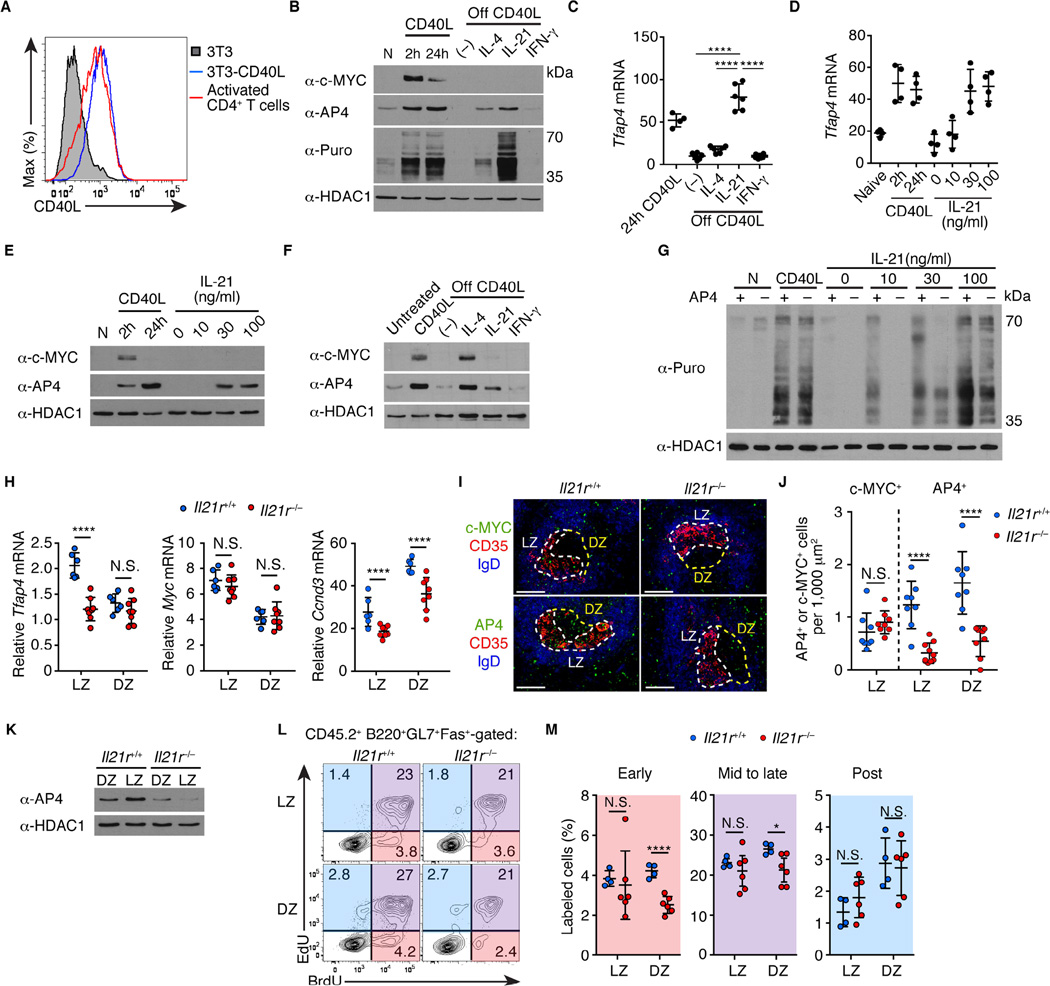
Figure 7. IL-21 sustains expression of AP4 after c-MYC downregulation.
(A) Flow cytometric analysis showing expression of CD40L on NIH-3T3 cells infected with a CD40L-expressing retrovirus compared to that in CD4+ T cells polarized in vitro for 2 days.
(B) AP4 and c-MYC protein amounts and puromycin (Puro) incorporation in naive (N), stimulated B cells with CD40L, and those subsequently stimulated with cytokines without CD40L (off CD40L). (–) denotes no cytokines added. Data are representative of three independent experiments.
(C) Cell-number normalized Tfap4 mRNA expression in activated B cells from (B). Data are pooled from two independent experiments.
(D and E) Cell-number normalized Tfap4 mRNA and protein expression in B cells stimulated with CD40L and those subsequently stimulated with IL-21. Data are pooled from three independent experiments.
(F) AP4 and c-MYC protein expression in GC B cells ex vivo that were untreated, CD40L-stimulated, and those subsequently stimulated with cytokines without CD40L signals (off CD40L). (–) denotes no cytokine added. GC B cells were purified eight days after SRBC immunization. Data are representative of two independent experiments.
(G) Puromycin incorporation by Tfap4f/–Cd79aicre/+ and control Tfap4f/+Cd79aicre/+ naive B cells (N), CD40L-stimulated B cells, and those subsequently stimulated with different concentrations of IL-21 without CD40L. Data are representative of two independent experiments.
(H) Tfap4, Myc, Ccnd3 mRNA amounts in Il21r+/+ and Il21r−/− CD86hiCXCR4lo LZ and CD86loCXCR4hi DZ GC B cells from mixed bone marrow chimeras (Figure S7F) ten days after NP-CGG immunization. Data are pooled from three independent experiments.
(I and J) Staining for c-MYC and AP4 expression of spleen sections from mice in (H). LZ and DZ defined as in Figure 1E. Data are representative of three independent experiments. Scale bar, 100 µm. Statistical analysis of c-MYC- and AP4-expressing cell frequencies per 1,000 µm2 of LZ or DZ is shown in (J). Data are pooled from three independent experiments.
(K) AP4 protein amounts in LZ and DZ GC B cells in (H). Data are representative of three independent experiments.
(L and M) Cell cycle analysis by sequential EdU and BrdU labeling of CD45.2 Il21r−/− and control Il21r+/+ donor LZ and DZ GC B cells from mixed bone marrow chimeras in (H). Data are pooled from two independent experiments.
Data in (C, D, H, J and M) are shown by means ± SD. One-way ANOVA for (C), and unpaired Student’s t test for (H, J and M). n = 4–6 (B–E); n = 2 (F); n = 2 per group (G); n = 6 for Il21r+/+ and n = 8 for Il21r−/− (H); n = 4 for Il21r+/+ and n = 6 for Il21r−/− (I–M). See also Figure S7.

