
Figure 6. Distribution of water use (mm) for 18 grain legume species.
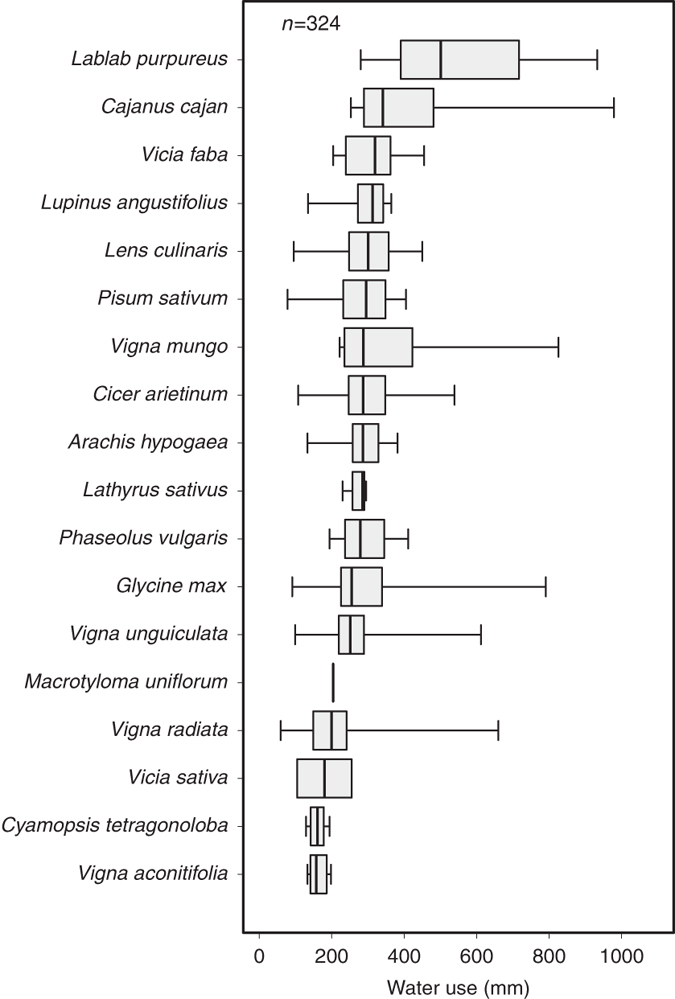
Water use is calculated using different types of equations, indicated within the ‘Crop_Water_Use_Balance_Equation’ attribute. The distribution is derived using data extracted from the database without additional calculations. Intrabox lines indicate medians, box edges indicate 25th and 75th percentiles, and whiskers indicate minimum and maximum values. The number of observations (n) is also indicated. The scientific names of the species are ranked in descending order of median values.