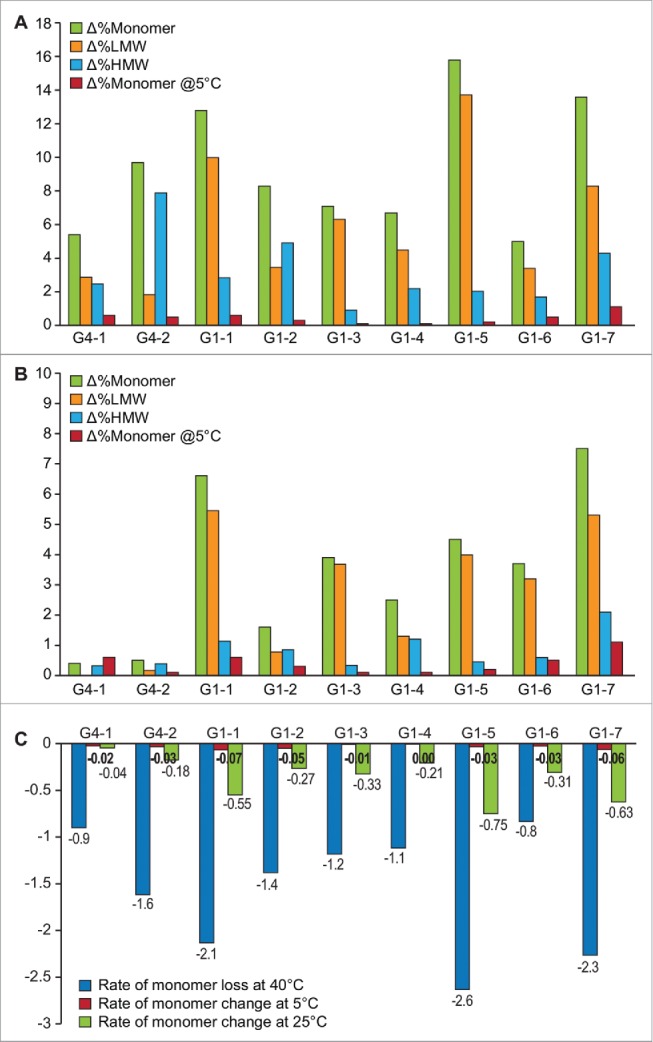
Figure 1.

Change in % Monomer, %HMW, %LMW by SEC after 6 months of storage at 40°C along with the corresponding loss in monomer at long-term 5°C storage (A) and after storage at 25°C (B). Green bars = Δ%Monomer, orange bars = %ΔLMW, blue bars = %ΔHMW, red bars = Δ%Monomer at 5°C (C) Rate of monomer loss at 40°C, 25°C and 5°C storage conditions.
