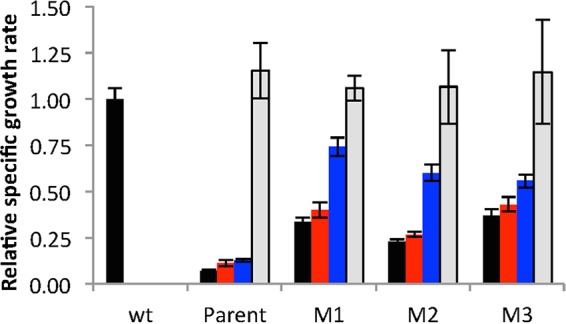
FIG 3.

Effect of point mutations M1, M2, and M3 on the growth rate of ΔargC proA* E. coli cells. Black bars, M9/glucose; red bars, M9/glucose plus 0.4 mM proline; blue bars, M9/glucose plus 5.2 mM arginine; gray bars, M9/glucose plus 0.4 mM proline and 5.2 mM arginine. wt, wild type. Error bars represent standard deviations from 3 replicates.
