
FIG 6.
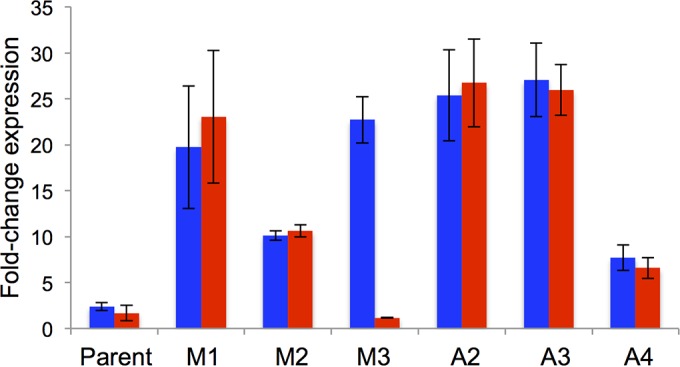
Levels of expression of proA (blue) and proB (red) in the parental ΔargC proA* strain and in strains containing M1, M2, M3 or segmental amplifications (A2, 12.8-fold; A3, 22-fold; A4, 5.2-fold) relative to their expression in wild-type E. coli BW25113. Error bars represent standard deviations from three biological replicates. (cysG and idnT were used as internal references.) Error bars represent 95% confidence intervals from 3 replicates.