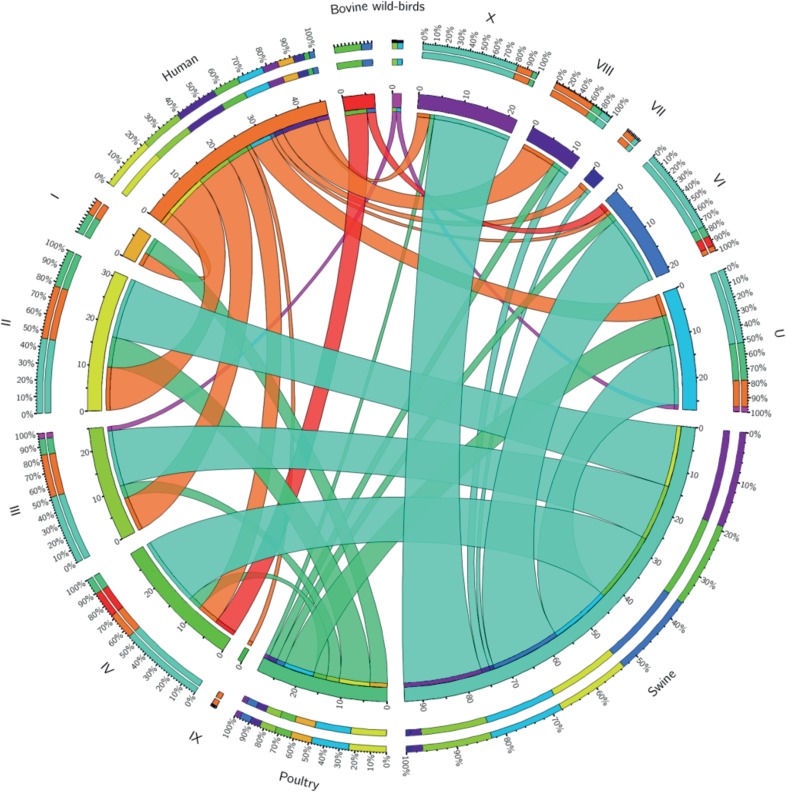
FIG 3.
Host-LOS locus class association. A Circos diagram shows the distribution of LOS locus classes of C. coli strains isolated from different hosts, from both our collection and that of Richards and colleagues (26). Ribbon ends represent links between host and LOS locus class, while the width of the ribbon correlates with the percentage of strains belonging to a specific LOS locus class in a certain host. Segments in the outer ring indicate the percentage of strains representing a certain LOS locus class or host, while the inner ring indicates the number of strains. Human strains are shown in orange, bovine strains are shown in red, poultry strains are shown in green, and swine strains are shown in cyan.

