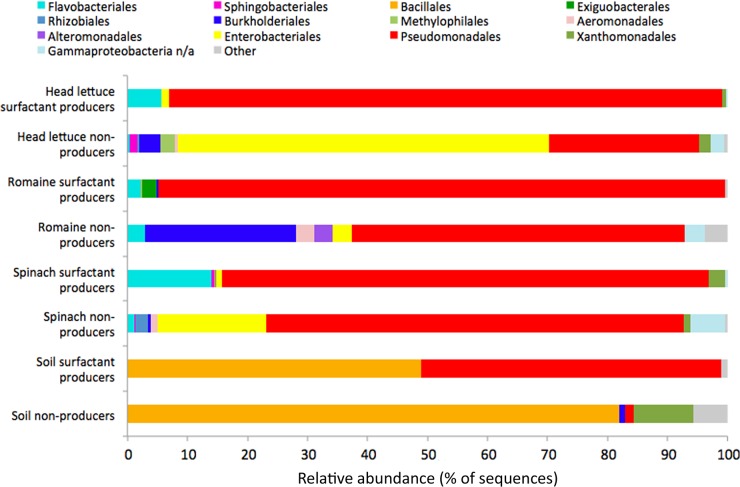
FIG 3.
Composition of cultured bacteria characterized as surfactant producers and nonproducers from various habitats. The bars shown are averages of the proportional incidence of isolation from two separate times of collection. The orders shown were observed in at least 1% of the amplicon sequences in at least one of the pools. Unclassified orders are indicated by “n/a.” Water samples are excluded due to the low number of surfactant producers recovered.

