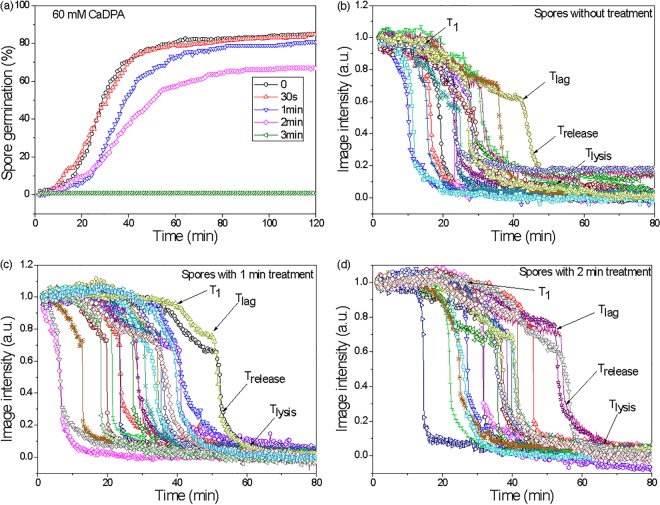
FIG 5.
CaDPA germination of spores after CAP treatment. (a) CaDPA germination kinetics for various CAP treatment times (0, 0.5, 1, 2, and 3 min; >219 spores examined); (b to d) estimated kinetic parameters (T1, Tlag, Trelease, and Tlysis) of single spores (average of ∼20 individual spores) after various CAP treatment times (0, 1, and 2 min are shown).

