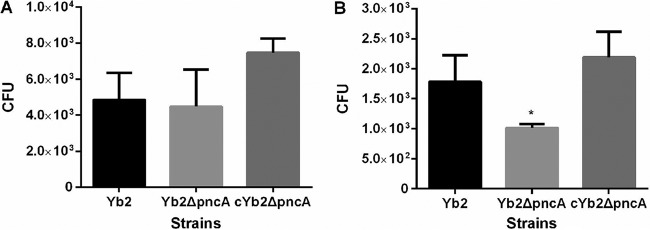
FIG 4.
Bacterial adherence (A) and invasion (B) assays. The assays were performed with Vero cells. Data represent the number of cell-associated bacteria (A) or bacteria invaded into Vero cells (B) in each well of 24-well plates. Error bars, standard deviations from three independent experiments that were performed in triplicate. *, P < 0.05.

