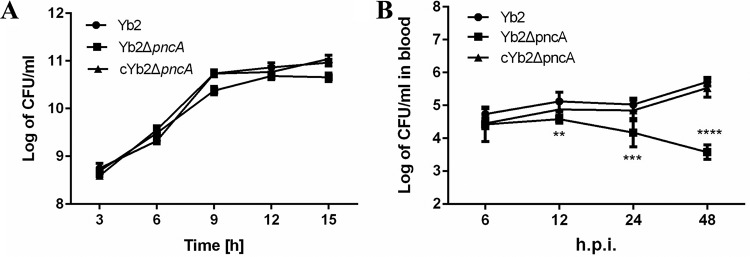
FIG 5.
Determination of bacterial growth in vitro and in vivo. (A) Bacterial growth curves in TSB. Bacterial CFU were counted at 3-h intervals, and the data are presented as the means of three replicates. No significant difference was observed among the R. anatipestifer wild-type strain Yb2, the mutant strain Yb2ΔpncA, and the complemented strain cYb2ΔpncA. (B) Bacterial loads in the blood of infected ducks. Six ducks each were infected with strain Yb2, strain Yb2ΔpncA, or strain cYb2ΔpncA at a dose of 1 × 10⁷ CFU. The bacterial loads were counted at 6, 12, 24, and 48 hpi. Data are means ± standard deviations. At 12, 24, and 48 hpi, the bacterial loads in the blood samples from ducks infected with strain Yb2ΔpncA were significantly smaller than those in samples from ducks infected with strain Yb2. The data were analyzed using one-way analysis of variance. **, P < 0.01; ***, P < 0.001; ****, P < 0.0001.

