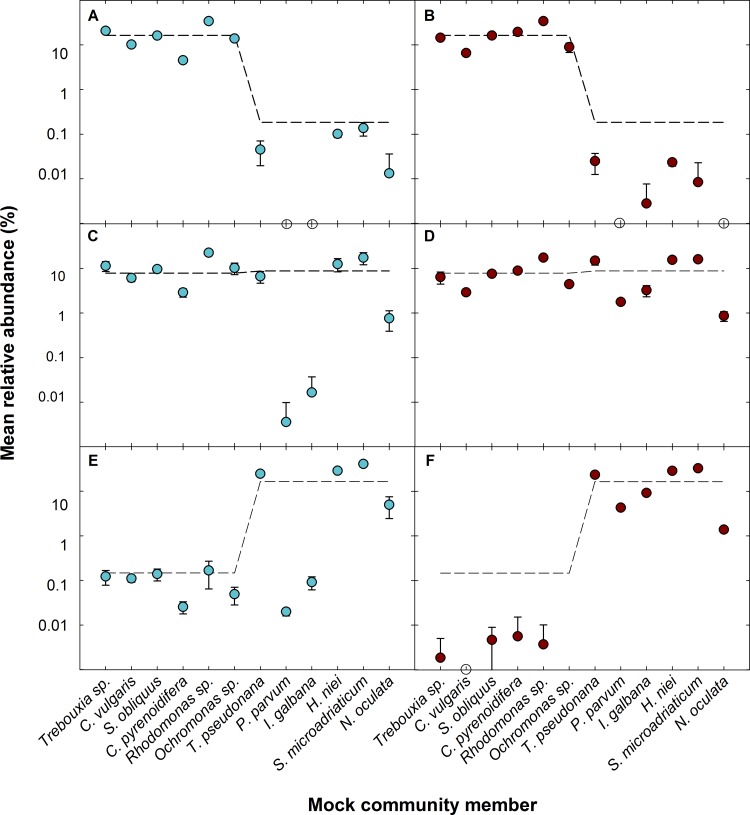
FIG 6.
Mean relative abundances of freshwater dominant (A and B), even (C and D), and marine dominant (E and F) communities corresponding to mock communities 2, 4, and 6 (MC2, MC4, and MC6), respectively, as represented by the V4 (A, C, and E; blue) and V8-V9 (B, D, and F; red) regions. The dashed lines indicate the mean relative abundance of the theoretical community. The V4 primer set consistently underrepresented the marine haptophyte members P. parvum and I. galbana. Although the V8-V9 primer set struggled to represent members when in low abundance, it more accurately represented the overall community structure.

