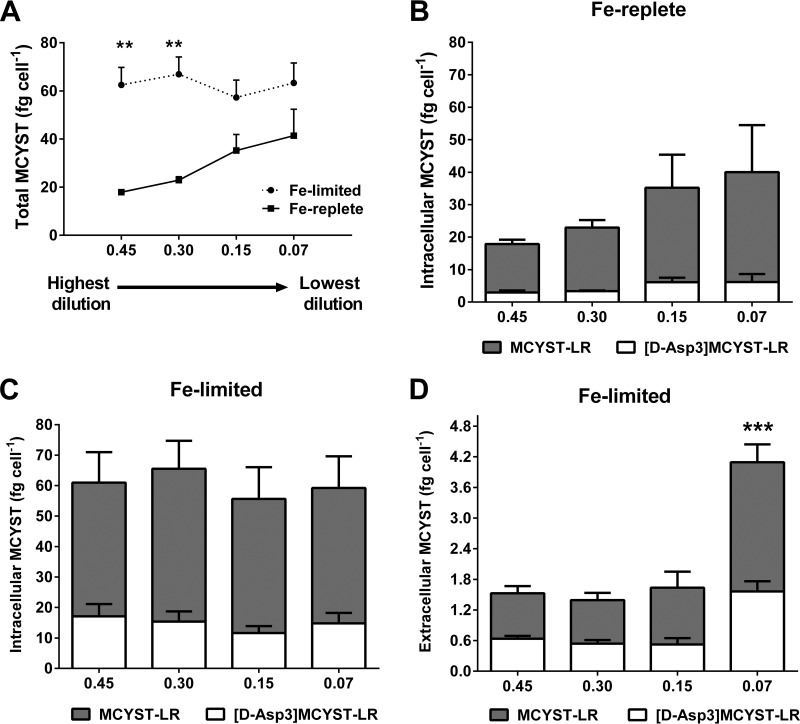
FIG 1.
LC/MS analyses of microcystin from Fe-limited and Fe-replete chemostats. (A) Total MCYST quotas (QMCYST) in Fe-limited and Fe-replete chemostats. (B) Intracellular MCYST from Fe-replete cultures. (C) Intracellular MCYST from Fe-limited cultures. (D) Extracellular MCYST from Fe-limited cultures. For graphs B to D, shaded columns represent MCYST-LR and unshaded columns represent [D-Asp3]MCYST-LR. Error bars indicate standard deviation from biological triplicates. Extracellular MCYST was not detected in Fe-replete cultures. Asterisks indicate statistical significance after performing multiple-comparison tests between data for Fe-limited and Fe-replete cultures. X-axis numbers represent dilution rates per day.

