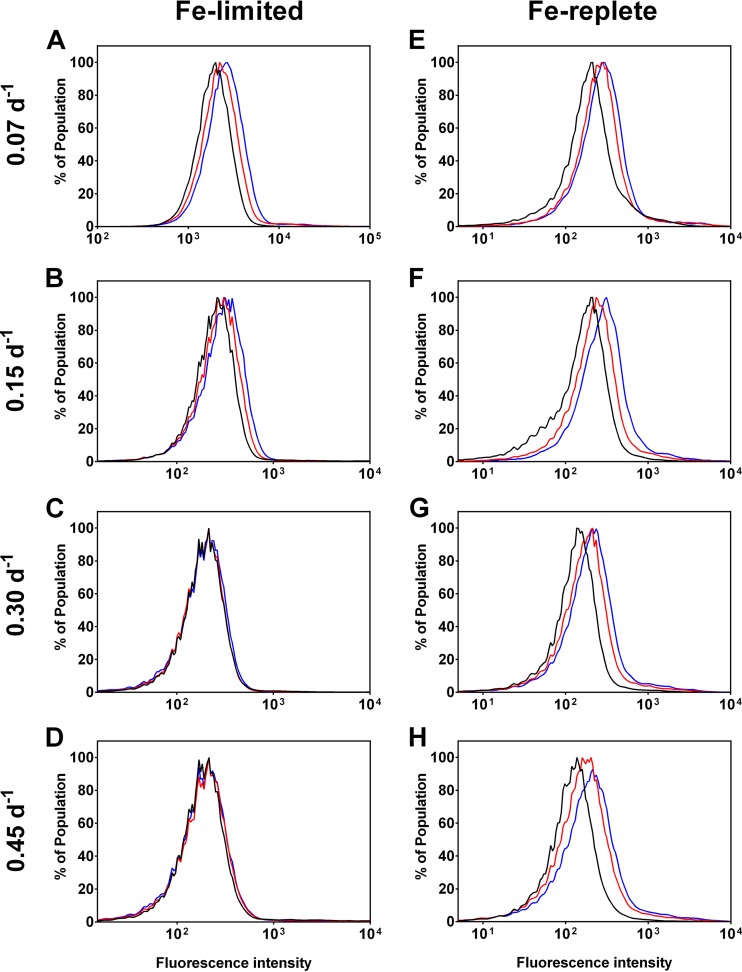
FIG 3.
Response to H2O2 in Fe-limited (left panels) and Fe-replete (right panels) chemostats. Baseline measurements (T0—black line) were taken prior to induced oxidative stress. Cells were incubated with 4 mM H2O2 to induce oxidative stress, where the cellular response was measured at 10 min (T10—red line) and 30 min (T30—blue line) after addition. Peak shifts to the right along the x axis indicate increased ROS detection and hence greater oxidative stress. Sample A had the highest ROS level at T0, as indicated by the right shift along the x axis.

