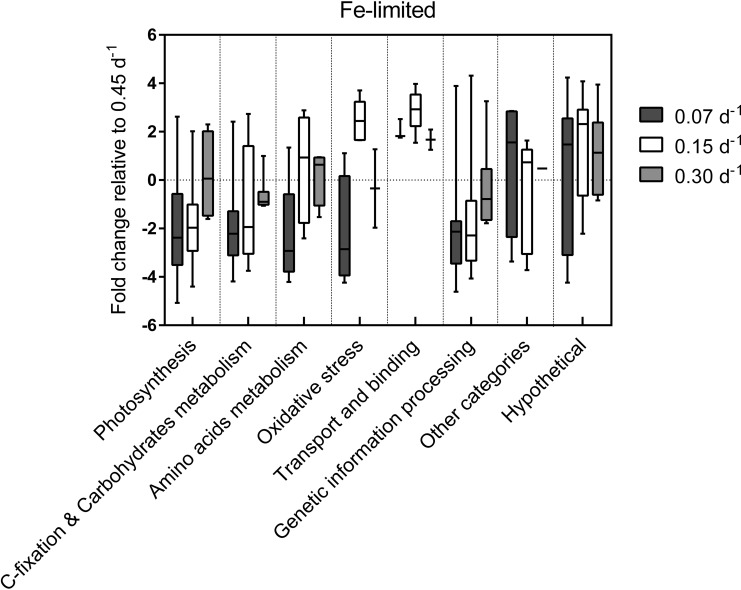
FIG 5.
Regulatory processes affected by dilution rates in Fe-limited cultures. Box plots represent the distribution of proteins with significant fold changes within each function category for each dilution rate relative to D = 0.45 day−1. Overall placement of the box above or below 0 conveys either an increase or decrease in the abundance of proteins from that functional category, respectively. The extent of the whiskers represents the minimum and maximum fold change of the proteins in that sample.

