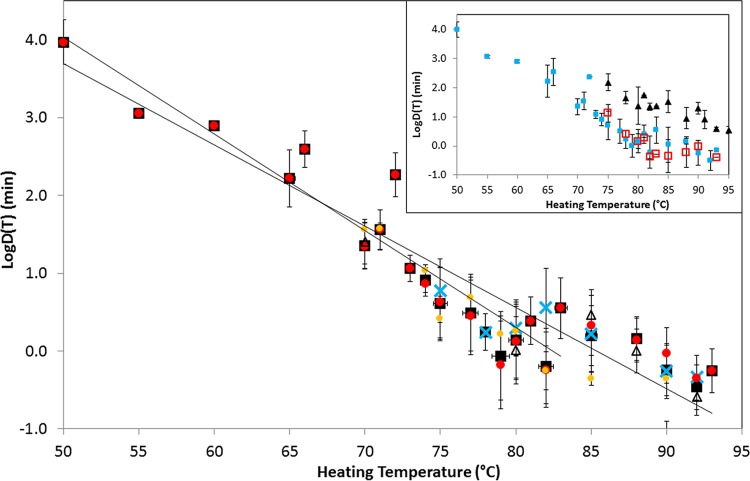
FIG 2.
Summary of the heat resistance (D values) of spores of nonproteolytic C. botulinum extracted from literature sources. Data points and error bars correspond to the mean and standard deviation of all of the D values measured at a particular experimental temperature in the absence of lysozyme. Black squares correspond to all of the data, and blue crosses, red circles, orange circles, and open triangles correspond to toxin types B, E, and F and mixed toxin types. The solid lines represent the best fit to the experimental data in a temperature range of 50 to 83°C and for the whole data set. The inset compares D values measured in the absence of lysozyme (blue closed squares) and those measured in the presence of lysozyme (HS fraction, red open squares; HR fraction, closed triangles).

