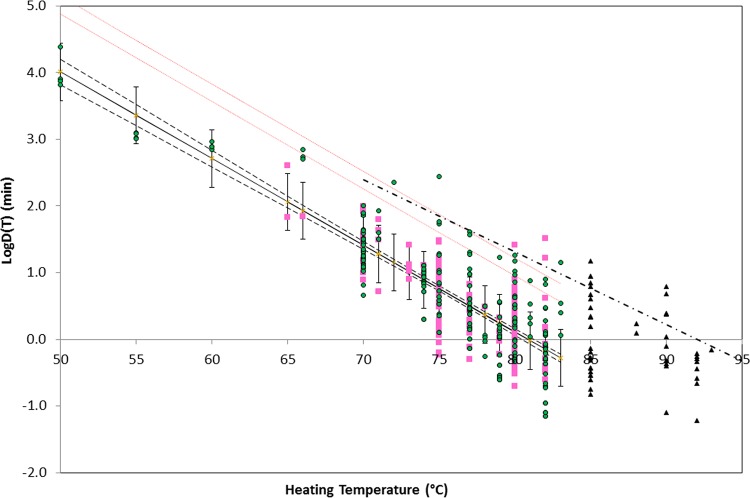
FIG 5.
Logarithms of previously published D values and fitted models of the heat resistance of spores of nonproteolytic C. botulinum in foods (green circles) and laboratory media (pink squares) that do not contain lysozyme. Black triangles indicate data that correspond to heating at temperatures that exceed 83°C, which are not included in the model. The black solid line is the line of best fit {log[D(T)] = 10.506 − 0.1299T with r = 0.72}, and the dashed lines indicate the 95% confidence interval for the fit. Red dotted lines represent the 95% and 99% UCLs of the predicted response. The dashed-dotted line indicates the current guidance of the United Kingdom Food Standards Agency (49)/Advisory Committee on the Microbiological Safety of Food (66) for heat treatments applied to chilled foods. Data are from references 31, 33–37, 40, 41, 45–48, 50, 51, 55, 60, 62–65, and 67–90 and unpublished work by J.-M. Membré and P. McClure and at the Institute of Food Research.

