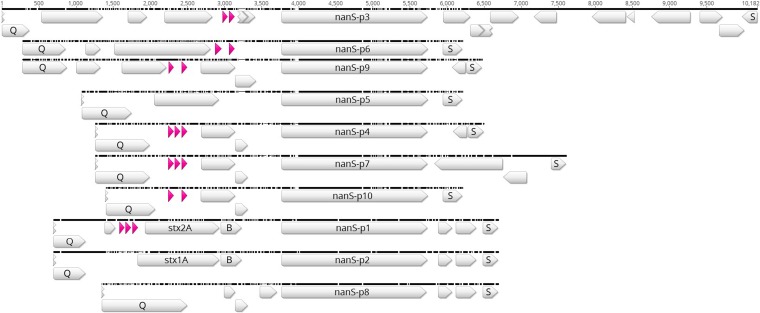
FIG 2.
Comparison of the prophage regions between genes Q and S in E. coli O157:H7 strain EDL933. ClustalW alignment of prophage regions was performed using Geneious R9 software. Blank and pink arrows depict different prophage genes and transfer ribonucleic acids (tRNA), respectively. The compared prophage regions are flanked by an antiterminator Q gene and a lysis S gene. The stx1A and stx1B genes as well as the stx2A and stx2B genes are labeled.

