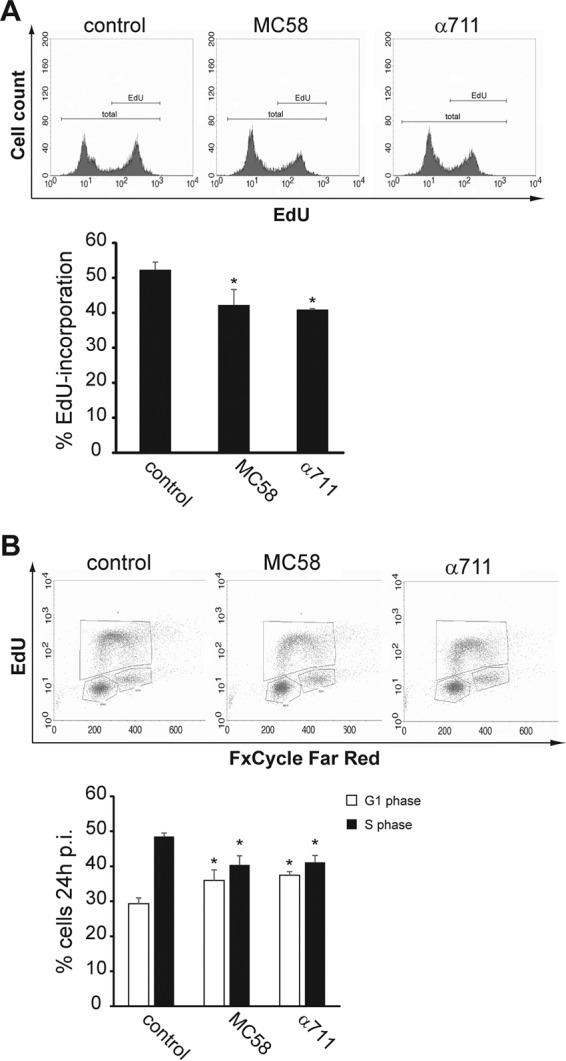
FIG 3.

Meningococcal infection decreases the number of Detroit 562 cells in the S phase. Detroit 562 cells were either left uninfected or were infected with MC58 or α711 (MOI of 100) for a 24-h time period. Cell proliferation analysis was performed using a Click-iT EdU Alexa Fluor 488 flow cytometry assay kit and FxCycle Far Red stain. During the final 2 h of infection, Detroit 562 cells were treated with 20 μM EdU, harvested, and then analyzed by flow cytometry. EdU was stained with Alexa Fluor 488 azide according to the manufacturer's protocol, followed by staining with 1 μM FxCycle Far Red stain for DNA content analysis. The cells were then analyzed by flow cytometry using either 488-nm excitation for the EdU Alexa Fluor 488 dye or 633-nm excitation for the FxCycle Far Red stain. (A, upper panel) The results of a representative experiment are shown. The complete population (total) and the EdU-positive (EdU) populations are indicated. (Lower panel) The results of a statistical analyses of the percentages of the cell population incorporating EdU in uninfected control cells, MC58-infected cells, or α711-infected cells from three independent experiments are shown. The data are shown as means ± the standard deviations (*, P < 0.05). (B, upper panel) The results of a representative experiment are shown, and cells in the G1, S, and G2/M phases are gated in boxes. (Lower panel) The results of a statistical analyses of the percentages of the cell population in the S phase in uninfected control cells, MC58-infected cells, or α711-infected cells from three independent experiments are shown. The data are shown as means ± the standard deviations (*, P < 0.05).
