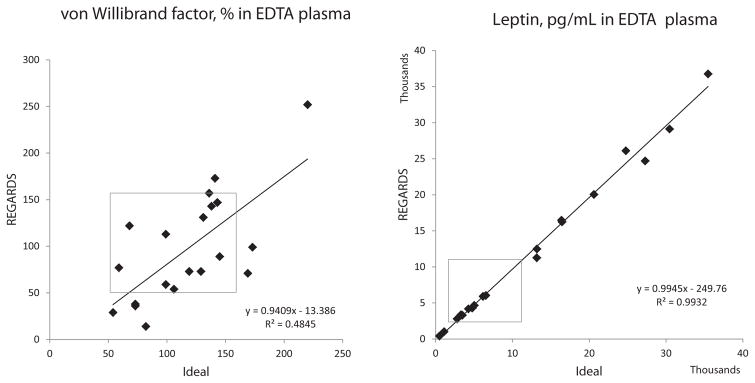
Fig. 1.
Examples of analytes affected (von Willebrand factor) and unaffected (leptin) by REGARDS processing. Scatter plots show untransformed raw data, and best-fit linear regression lines and equations, with results from ideally processed samples on the x-axis and results from samples processed using simulated REGARDS processing on the y-axis. Grey boxes highlight the reference ranges of the analytes: 50–160% for von Willebrand factor, and 2000–11,100 pg/mL for leptin.

