Fig. 1.

H3.V co-localizes with base J at cSSRs and regulates J synthesis.
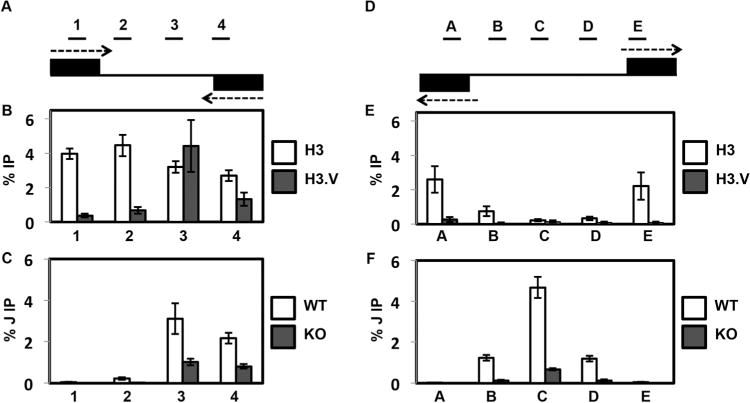
A. Map of cSSR 12.1 (12.1 indicates the first termination site on chromosome 12, following nomenclature established by van Luenen et al. (van Luenen et al., 2012). Genomic coordinates for all L. major cSSRs are listed in Reynolds et al. [Reynolds et al., 2014]). Black boxes represent the final gene in the opposing gene clusters. Arrows indicate the direction of transcription. Lines above the map indicate PCR amplified regions 1–4 utilized in the ChIP-qPCR analyses. Not to scale.
B. Localization of H3 and H3.V across cSSR 12.1 in WT cells determined by ChIP-qPCR using H3 antisera and H3.V antisera. The average of three independent IPs is plotted as the percent IP relative to the total input material. All IPs were background subtracted using a no antibody control. White bars, H3 ChIP; dark grey bars, H3.V ChIP. Error bars represent the standard deviation.
C. J localization across a cSSR in WT and H3.V KO cells. Anti-base J IP-qPCR analysis was performed for regions 1–4 within cSSR 12.1 of the indicated cell lines. The peak of J and the TTS have been shown to be within region 3 (Reynolds et al., 2014; van Luenen et al., 2012). The average of three independent IPs is plotted as the percent IP relative to the total input material. All IPs were background subtracted using a no antibody control. White bars, WT; dark grey bars, H3.V KO. Error bars represent the standard deviation. Reduction of J in the H3.V KO is statistically significant at region 3 and 4 as determined by a two-tailed Student’s t-test at a P-value <0.05.
D. Map of dSSR 6.1 (6.1 indicates the first initiation site on chromosome 6, following nomenclature established by van Luenen et al. [van Luenen et al., 2012]). Black boxes represent the initial gene in the opposing gene clusters. Arrows indicate the direction of transcription. Lines above the map indicate PCR amplified regions A–E utilized in the ChIP-qPCR analyses. Not to scale.
E. Localization of H3 and H3.V across dSSR 6.1 in WT cells. H3 and H3.V ChIP-qPCR were performed as described in B.
F. J localization across a dSSR in WT and H3.V KO cells. Anti-base J IP-qPCR analysis was performed for regions A–E within dSSR as described in C. Reduction of J in the H3.V KO is statistically significant at region B–D as determined by a two-tailed Student’s t-test at a P-value <0.05.
